Load shape workflow
Written By cedars team
Last updated About 1 month ago
Measure package developers can now create draft measure packages in the eTRM and then upload technology specific load shapes to CEDARS. Uploaded load shapes are brought together with eTRM permutation data to generate impact profiles; those impact profiles are then used to generate avoided cost data for the CET.
We will walk through the process step by step
Background: Load shapes in the CET
Historically in the CET the impact profile is identified by the E3MeaElecEndUseShape field, which is one of the four fields that together identify the avoided cost data to be used in cost effectiveness calculations. The three other fields are IOU_AC_Territory (e.g. SCE), E3TargetSector (e.g. Residential), and E3ClimateZone (e.g. 12). Those four fields together are called the Avoided Cost Combo in CEDARS. CEDARS enforces that CET input must match an Avoided Cost Combo to calculate cost effectiveness.
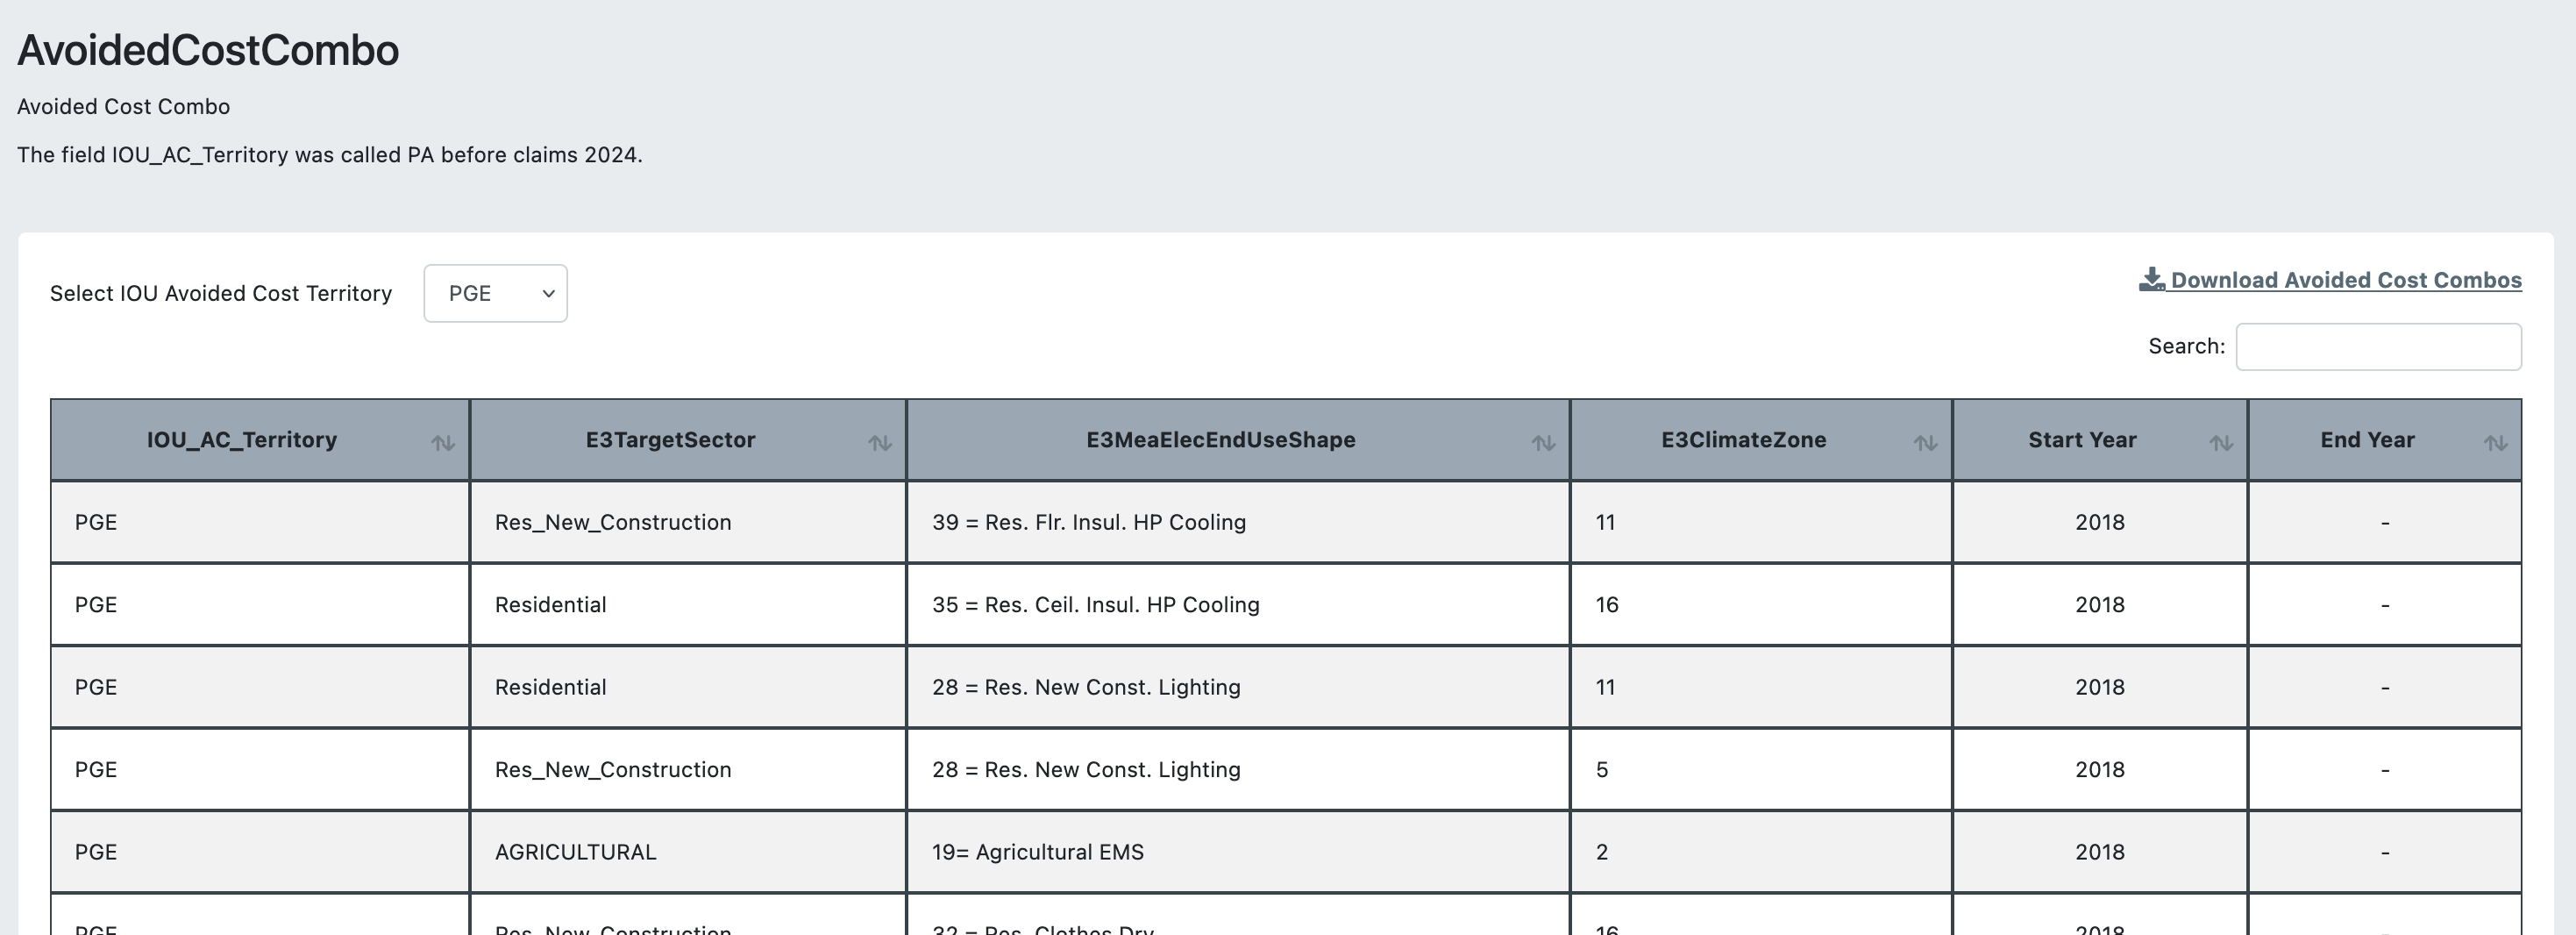
To align with the prior CET standards, new load shape derived impact profile ID are used as the E3MeaElecEndUseShape field for CET runs. As with historical DEER load shapes, the impact profile ID (E3MeaElecEndUseShape)will be used together with the IOU_AC_Territory, E3TargetSector, and E3ClimateZone to map to the new avoided cost data produced from the new load shapes.
Below we will walk through 1) the process to generate impact profiles from uploaded load shape data and the eTRM permutation data and then 2) the process the generate avoided costs for the CET from the impact profile and the utility.
An example load shape derived impact profile
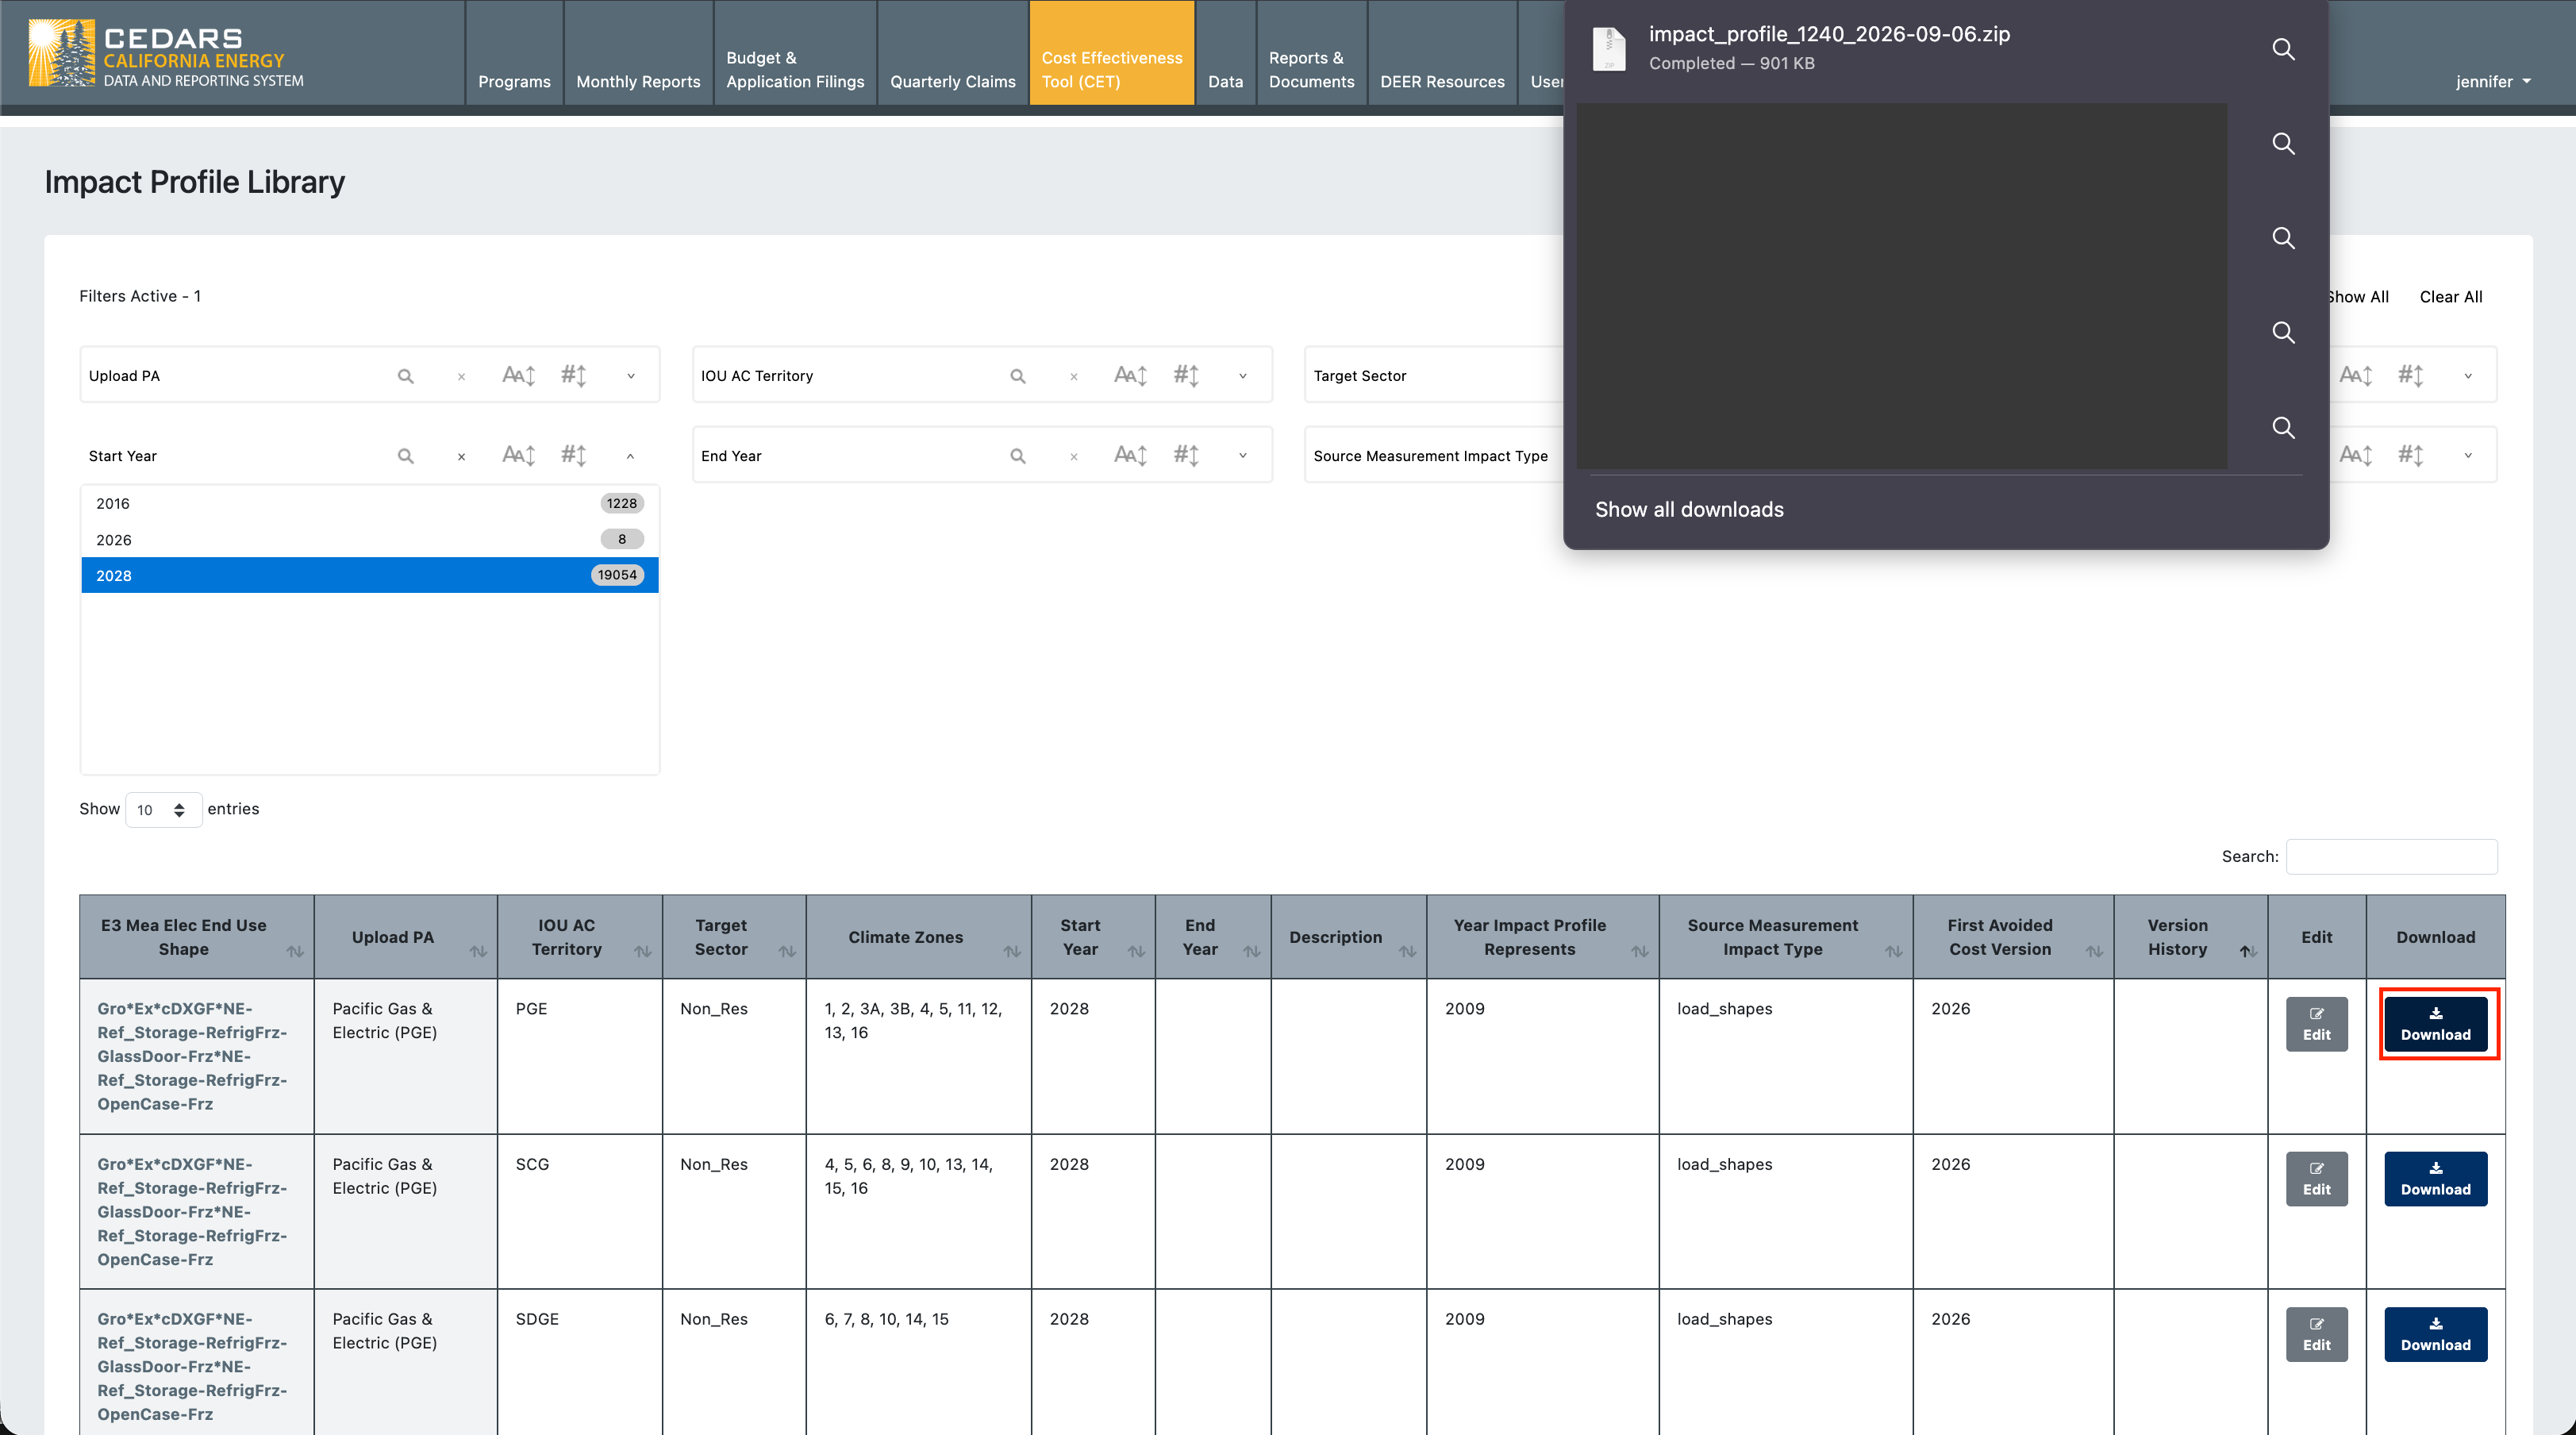
In CEDARS we can view the 19,000+ load shape derived impact profiles currently available in the impact profile library by selecting start year = 2028 in the filters.
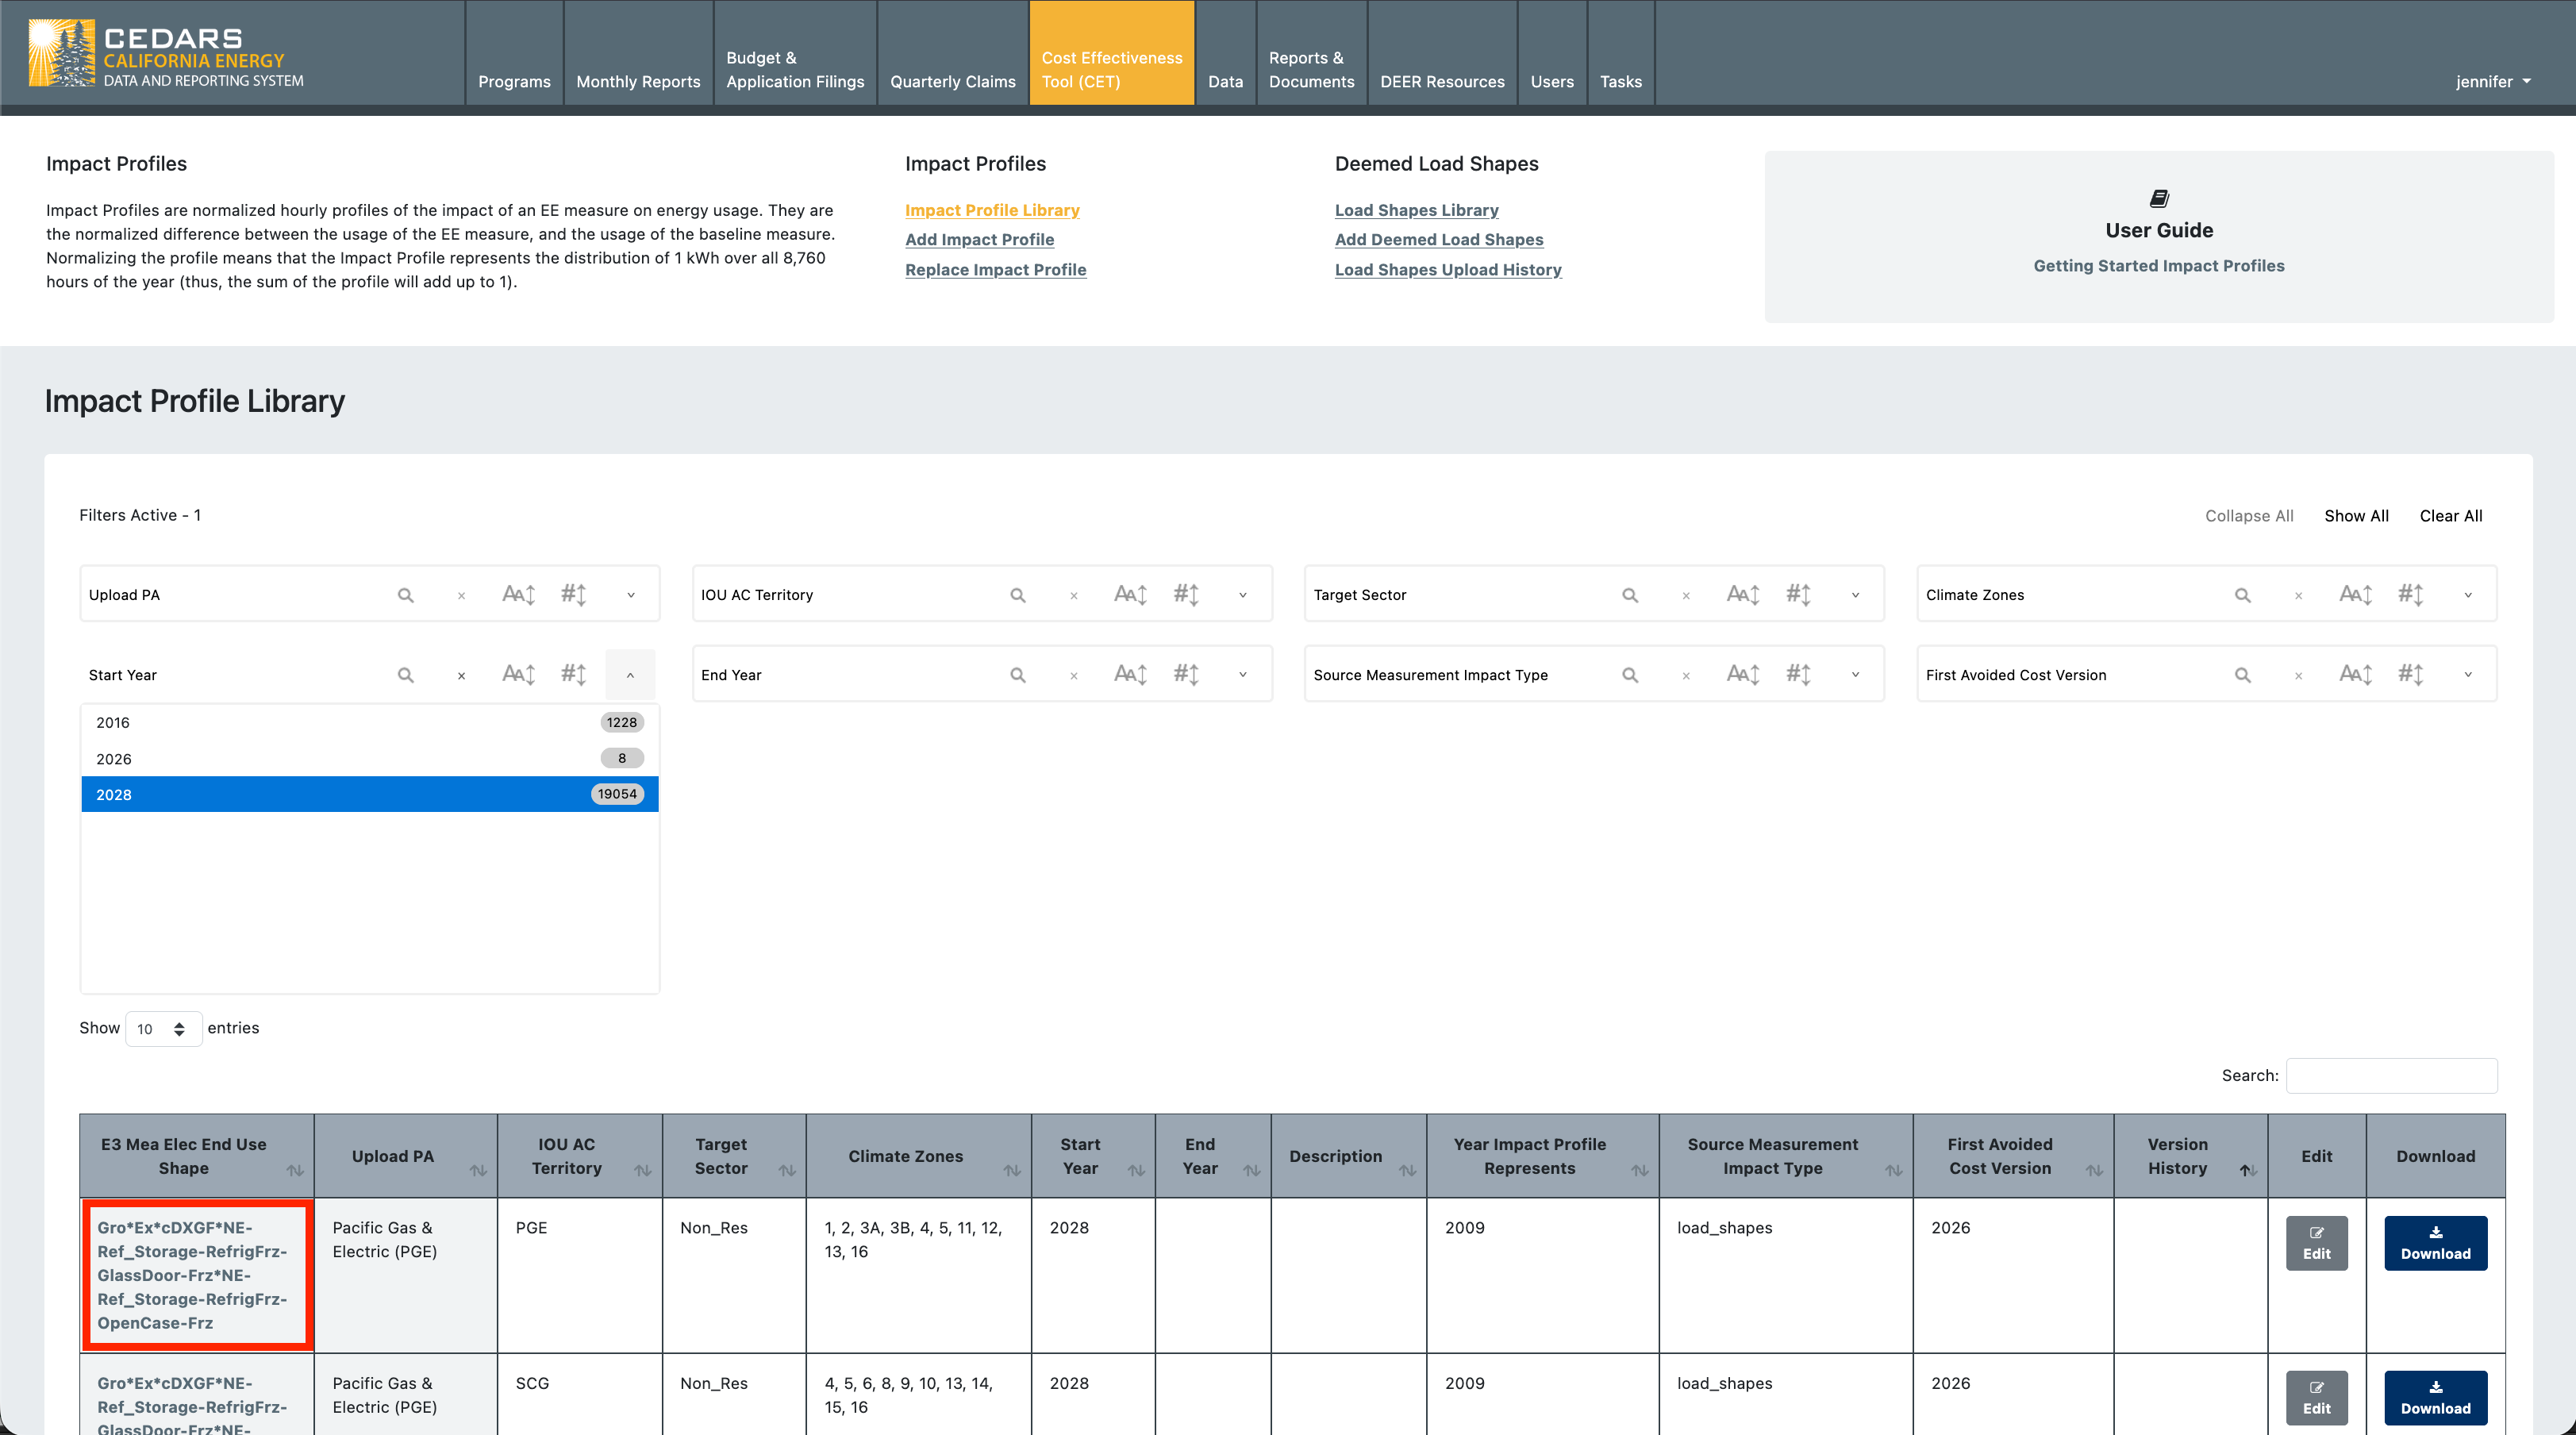
For this walk through we randomly chose the first impact profile ID (aka E3MeaElecEndUseShape) in the list. The E3MeaElecEndUseShape is:
Gro*Ex*cDXGF*NE-Ref_Storage-RefrigFrz-GlassDoor-Frz*NE-Ref_Storage-RefrigFrz-OpenCase-FrzIf we break down the concatenated string that makes up the E3MeaElecEndUseShape we have, in order:
Measure
BldgType=Gro(short for Grocery)BldgVint=Ex(short for Existing)BldgHVAC=cDXGF(short for split or packaged direct expansion unit with gas furnace)TechID=NE-Ref_Storage-RefrigFrz-GlassDoor-Frz
Base
TechID=NE-Ref_Storage-RefrigFrz-OpenCase-Frz`
So we can determine that our example is replacing an open case refrigerator or freezer with a glass door refrigerator or freezer in an existing grocery store powered by a gas furnace.
CEDARS and measure package developers generate E3MeaElecEndUseShape (aka Impact Profile ID) from the underlying data elements in the eTRM permutation data.
Inspecting impact profile and avoided cost data visually in CEDARS
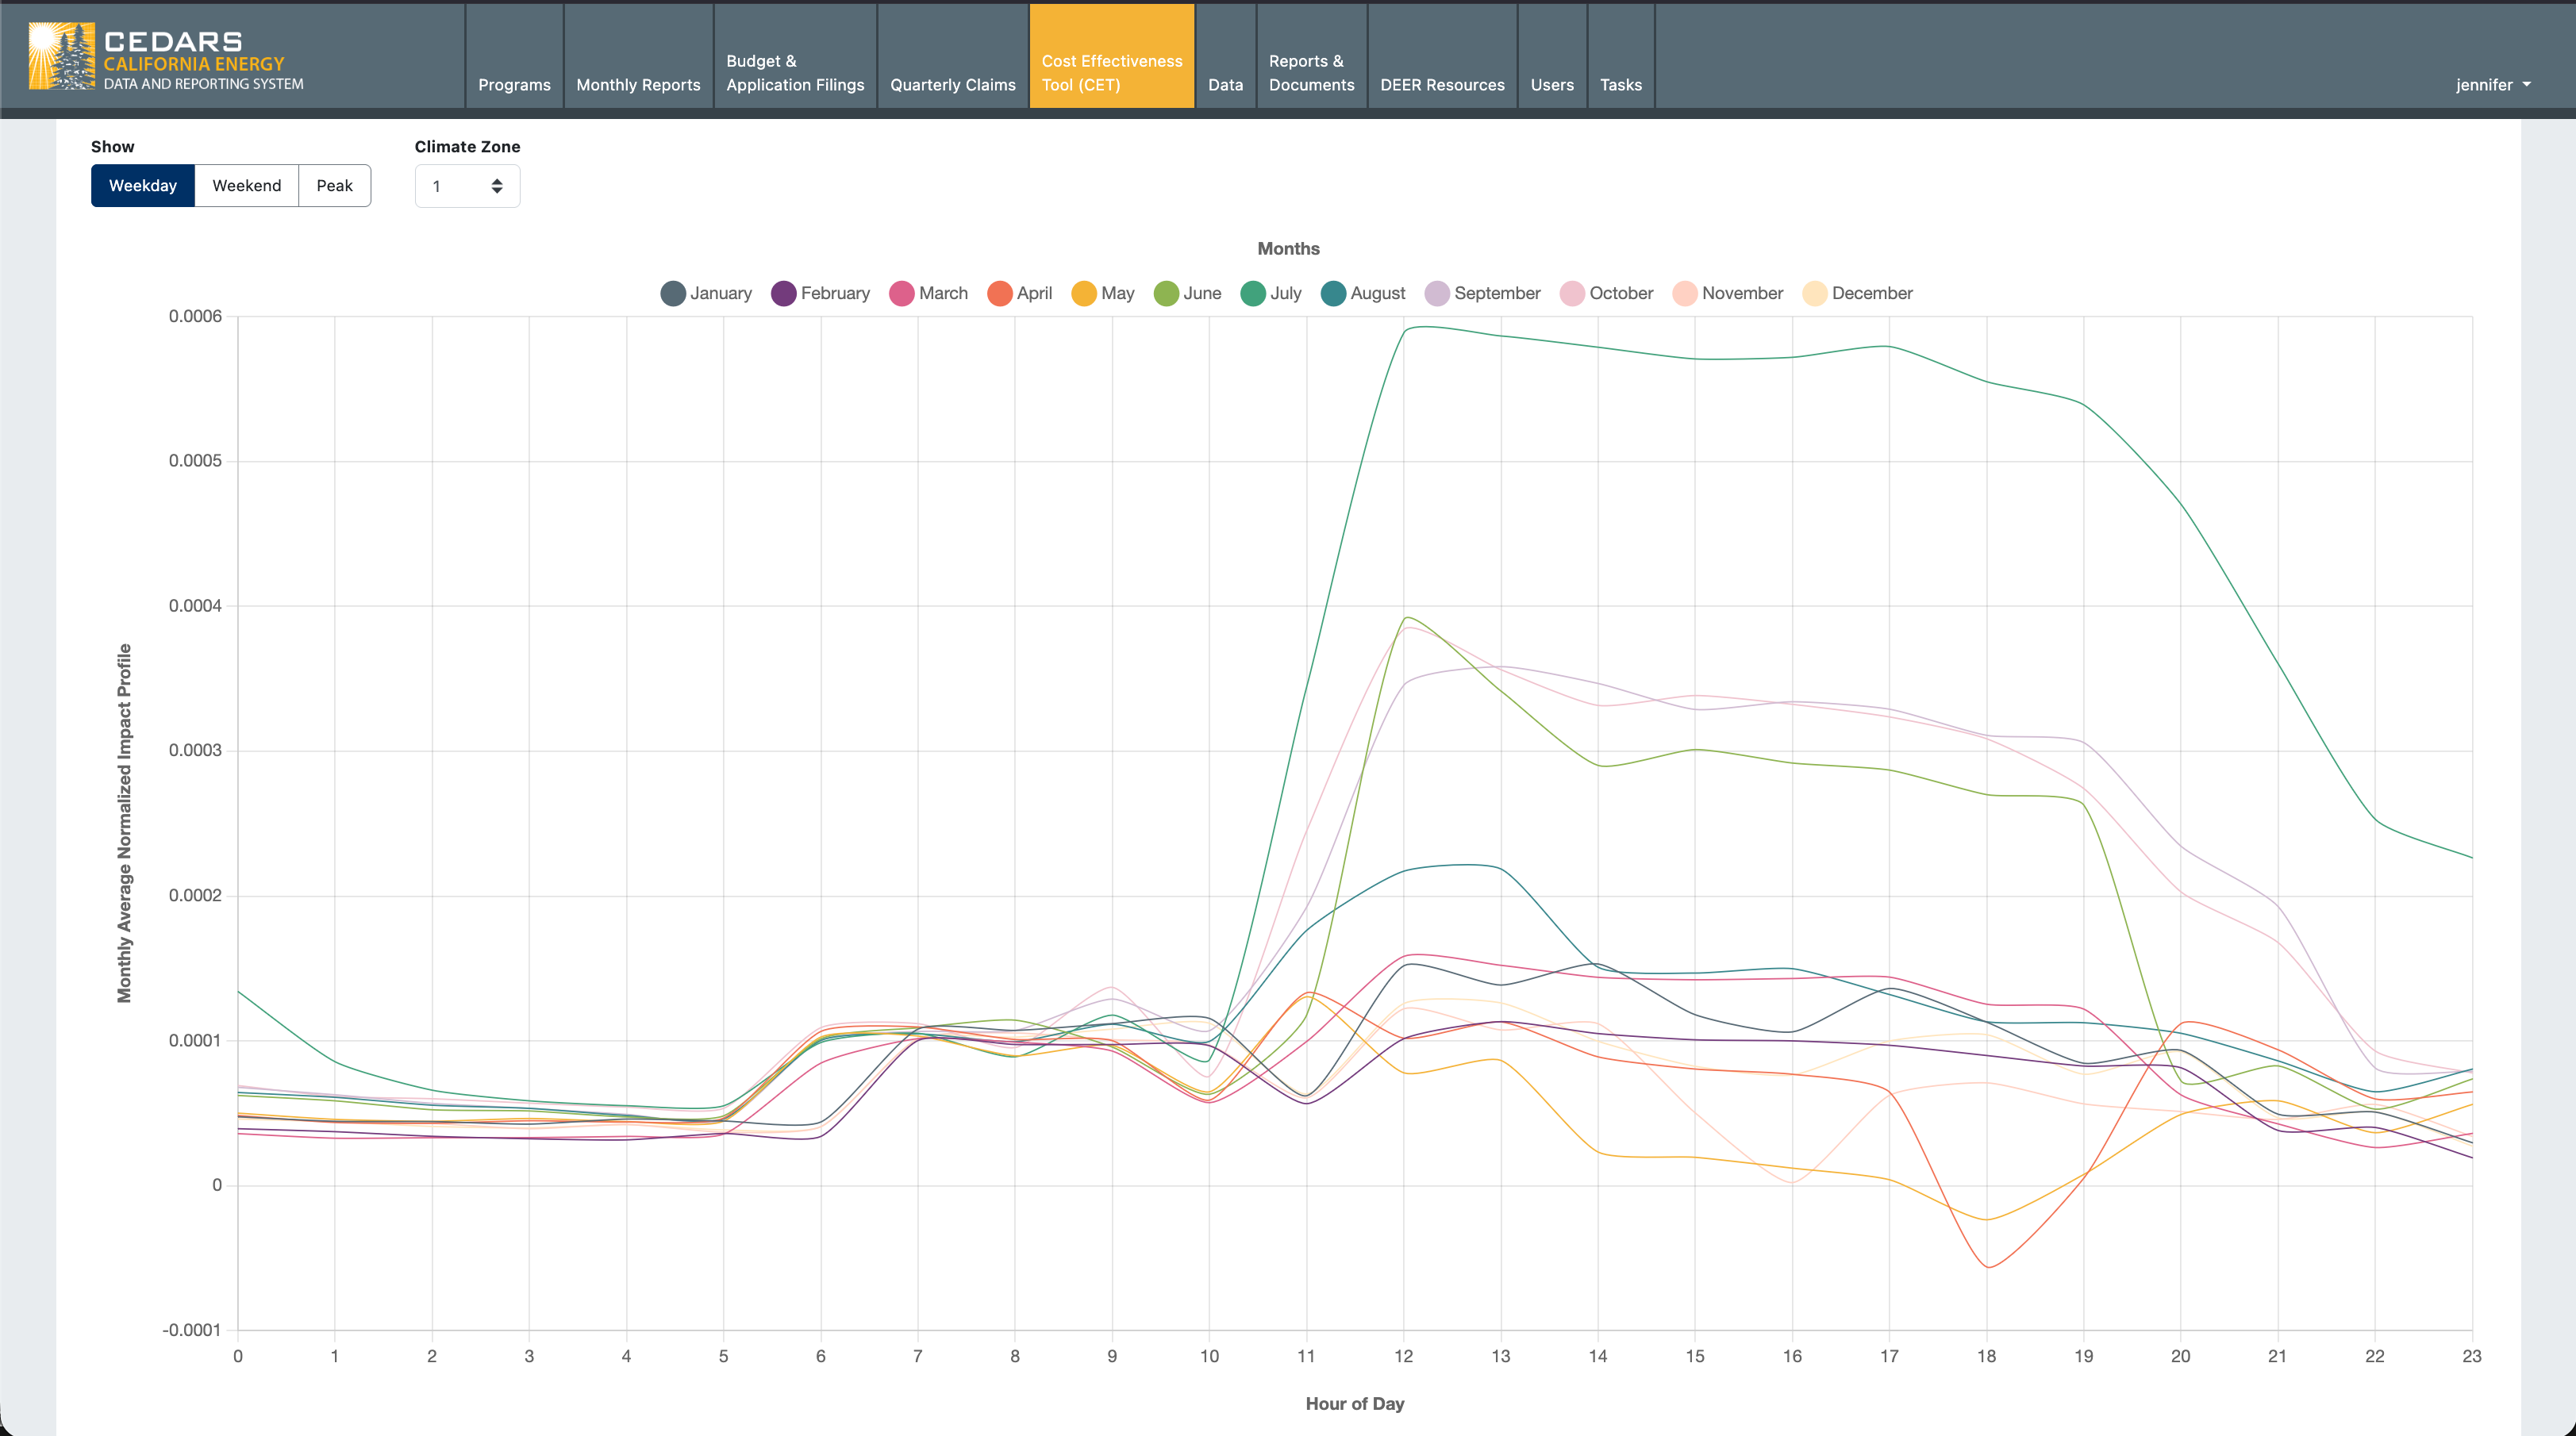
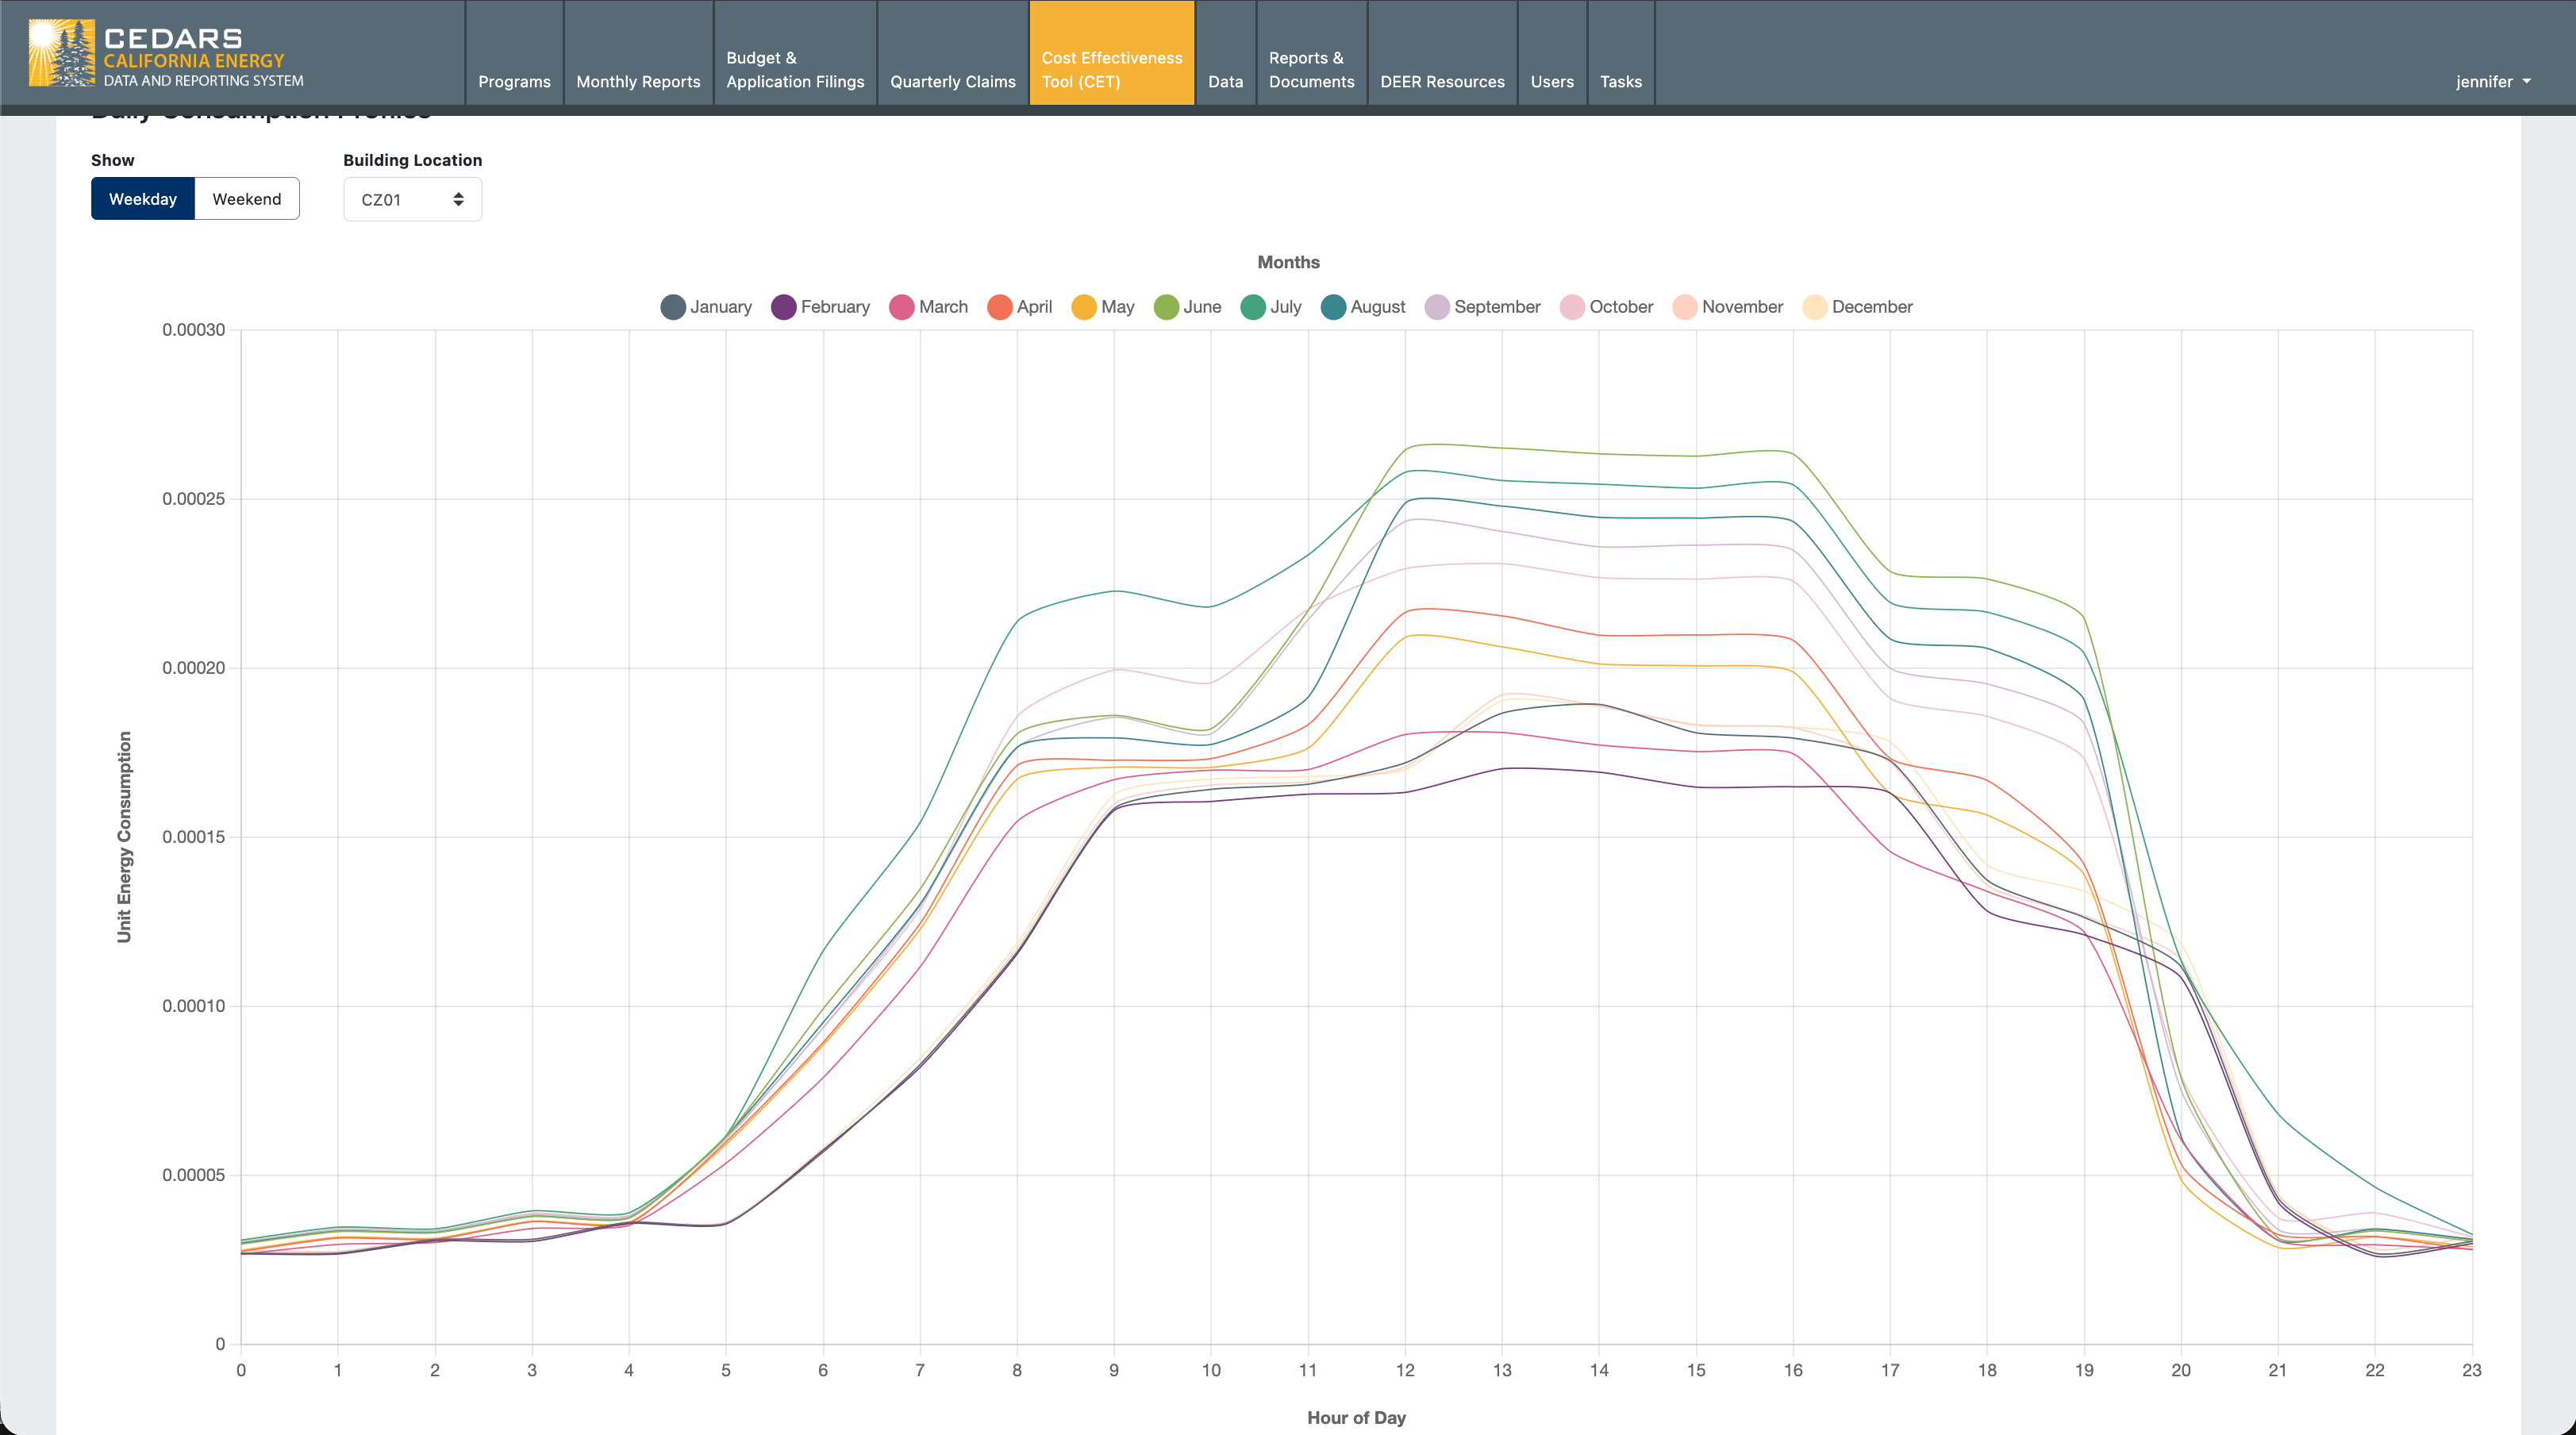
As we scroll down in the impact profile library page for our example we can inspect the monthly average impact profile for weekdays or weekends in the visualization:
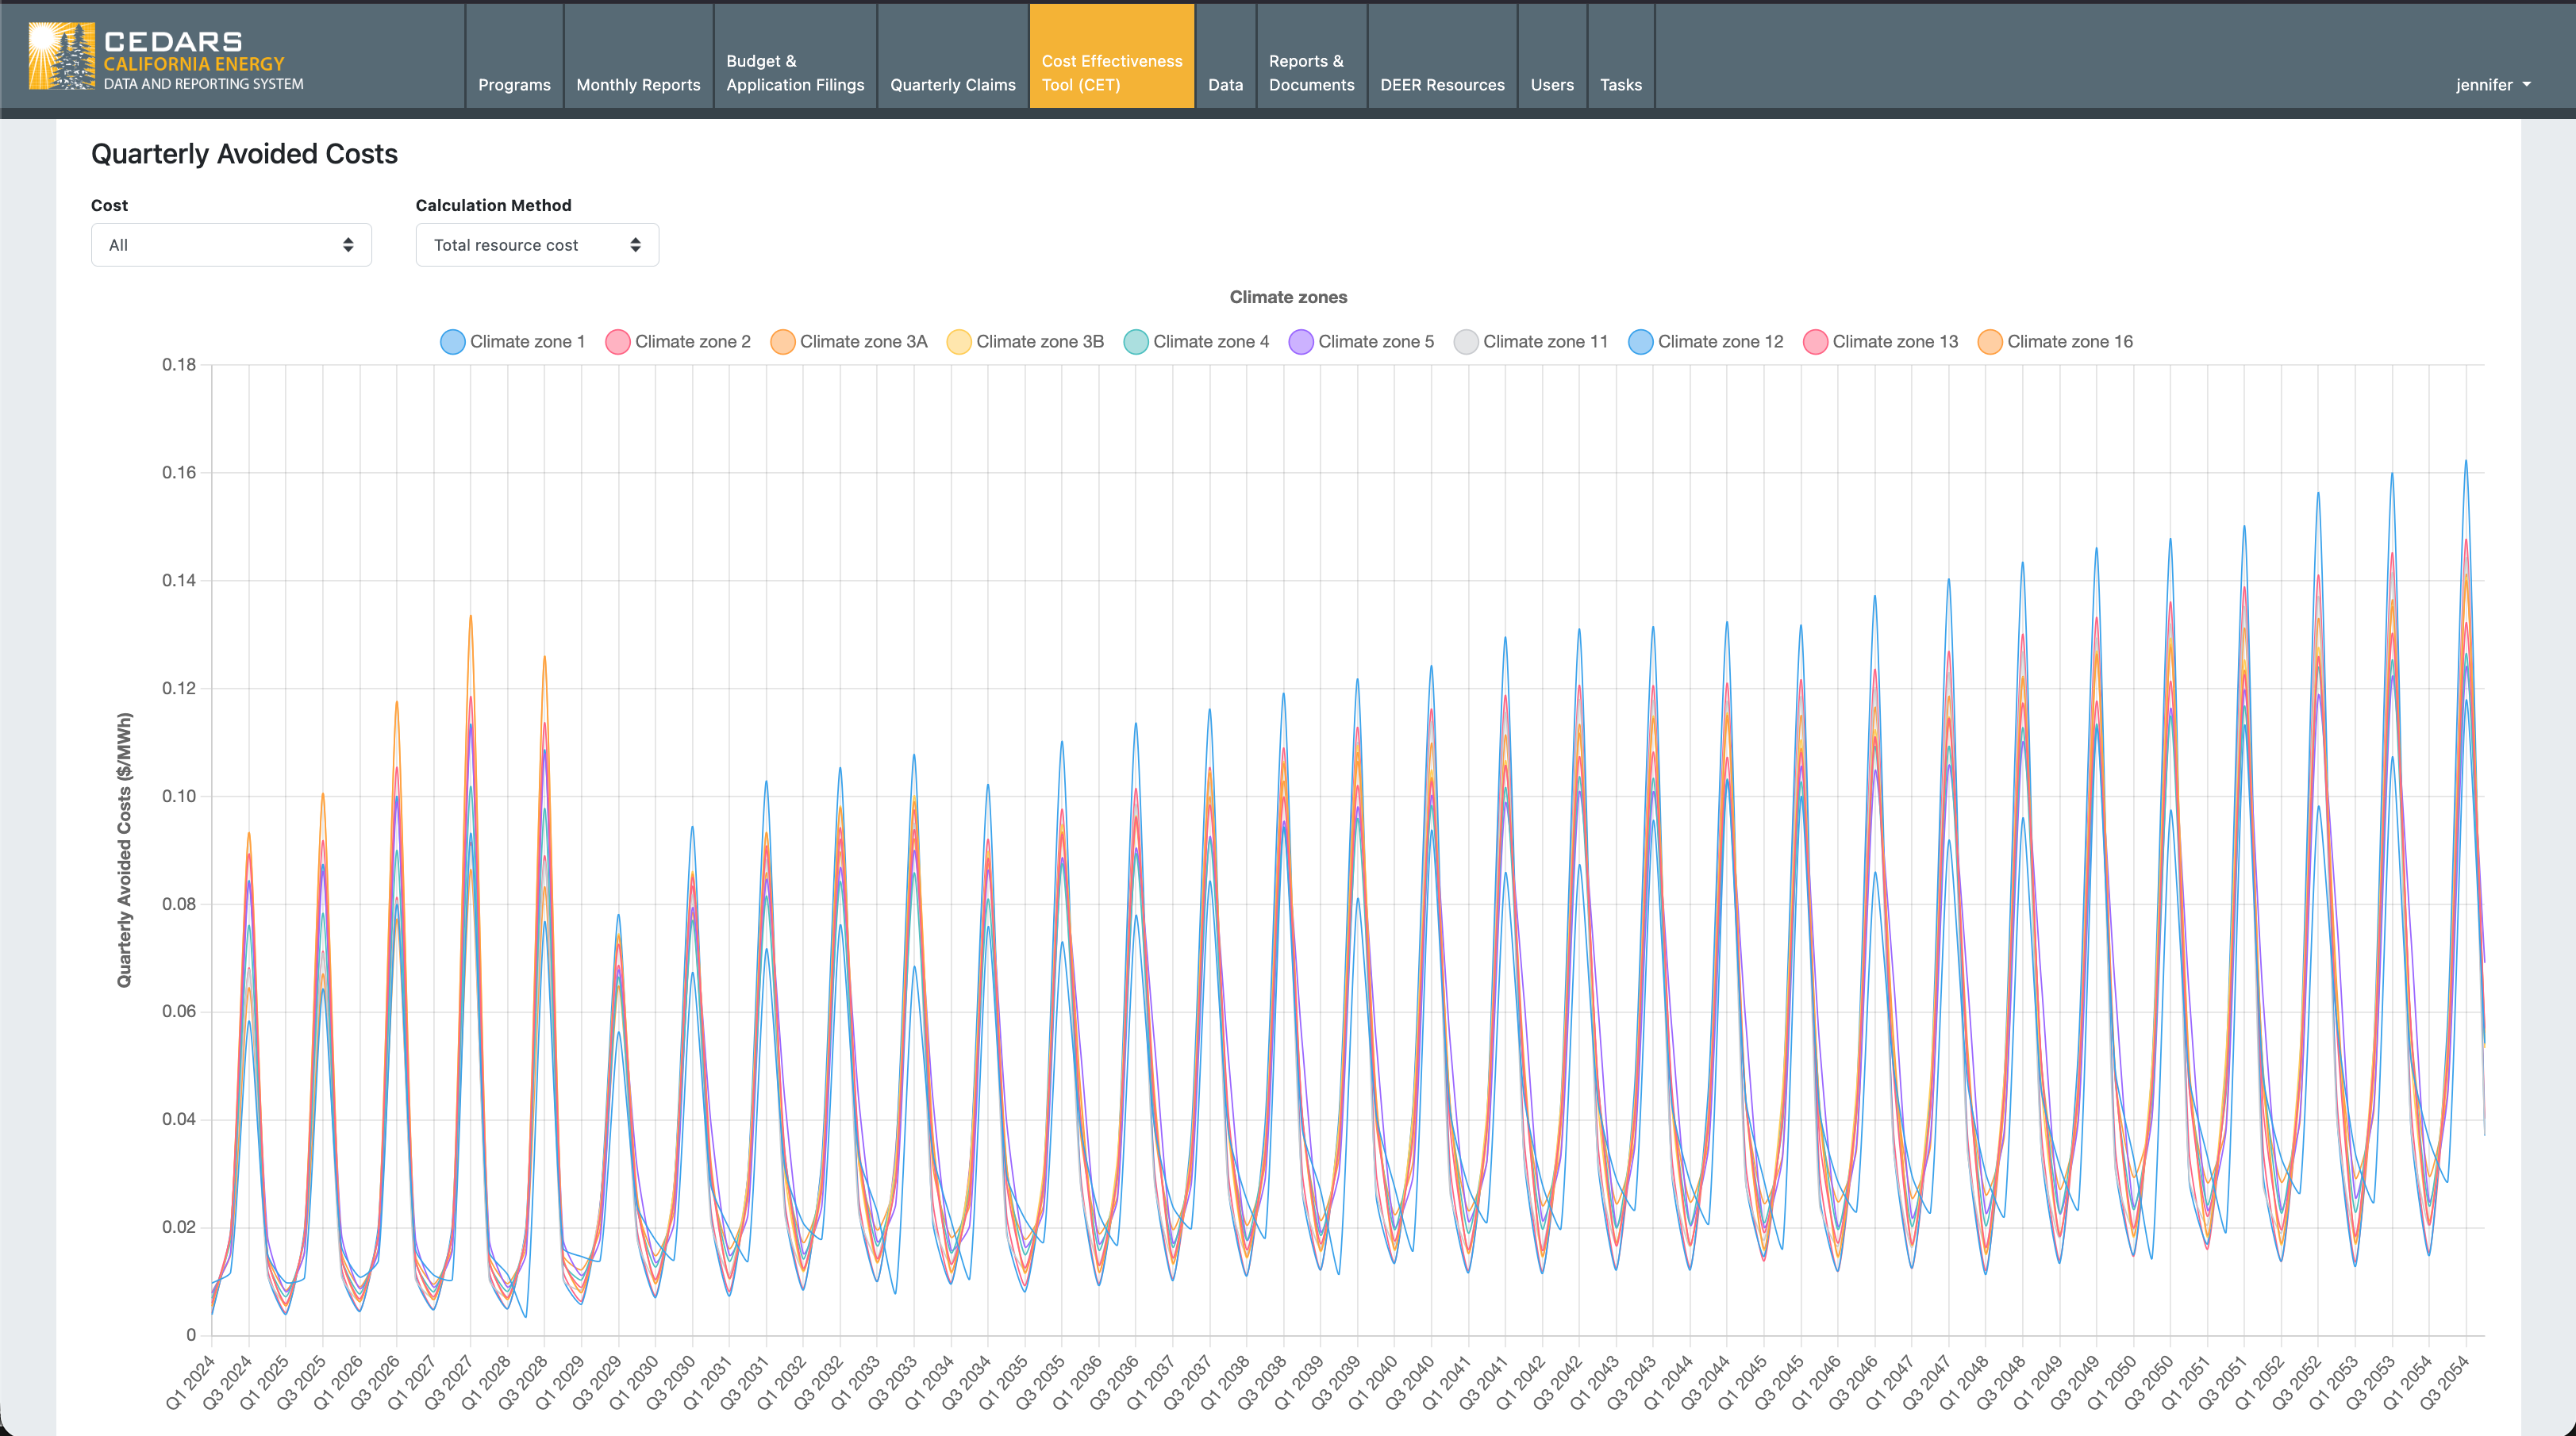
And when we scroll down below the impact profile visualization, we can inspect the generated 30 year forecast of avoided costs for that impact profile for all of the climate zones that were generated.
How to download the generated impact profile and avoided cost data.
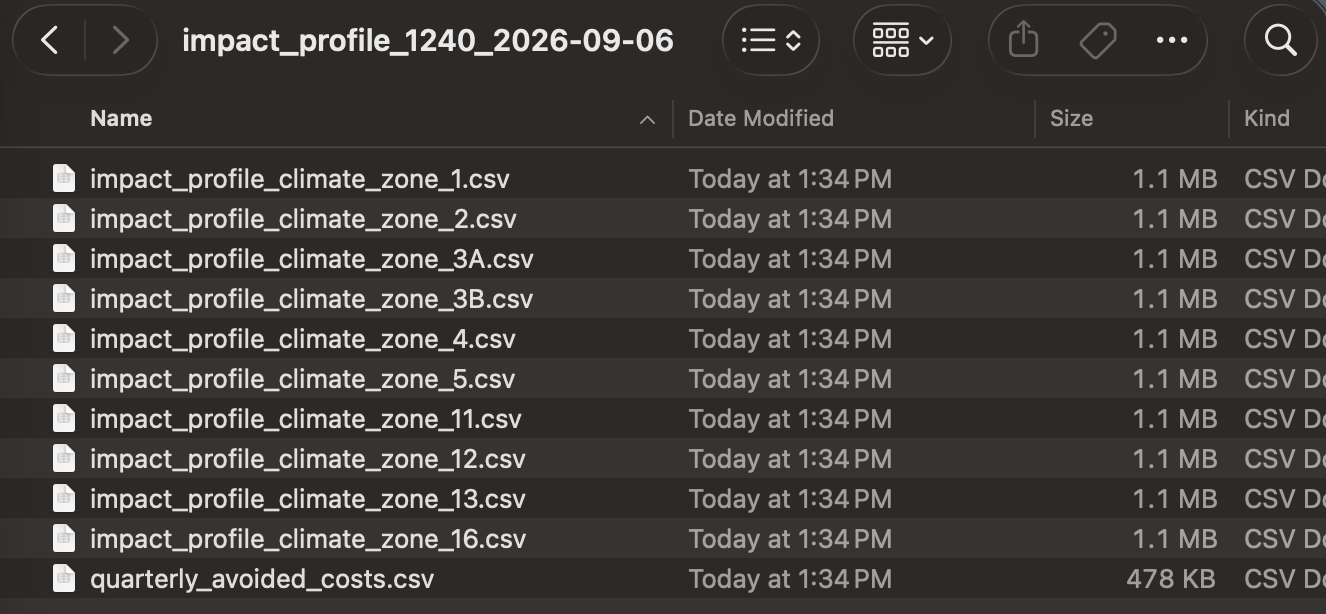
When you unzip the download file you will see a set of impact profile csv files, one for each climate zone, and one avoided cost data csv file.
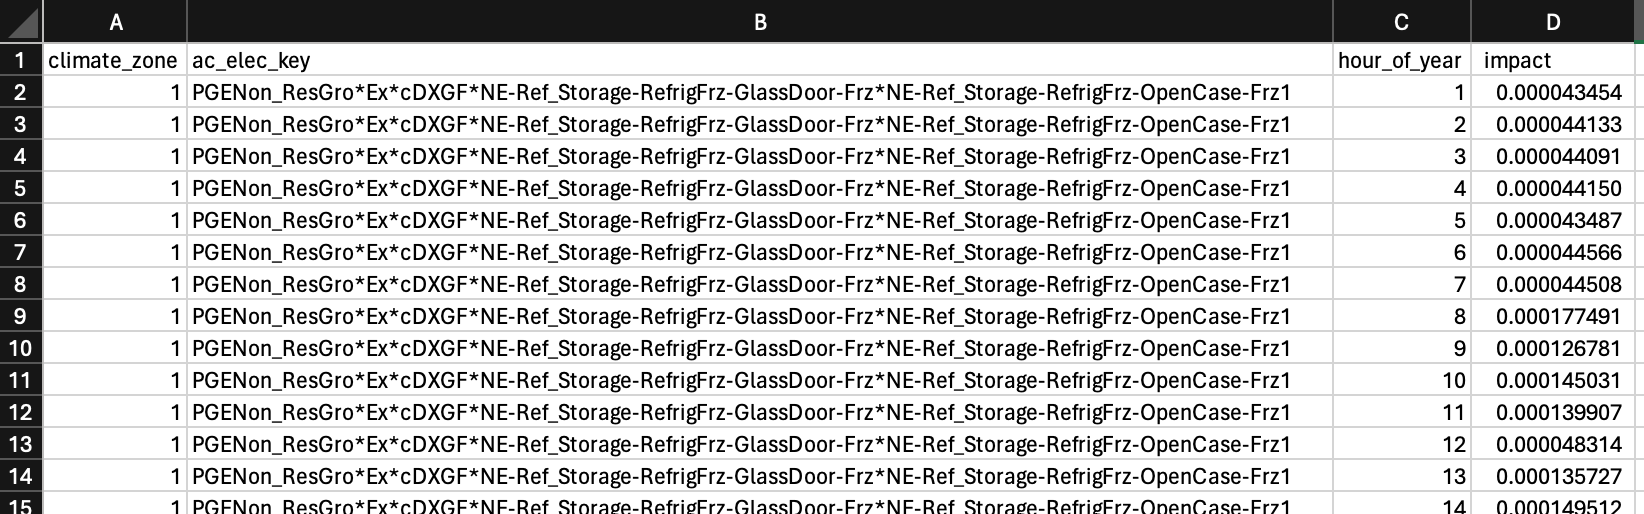
The impact profile csv files contain the normalized 8760 energy savings data.The file includes the ac_elec_key that is the concatenation of the IOU_AC_Territory, E3TargetSector, E3MeaElecEndUseShape, and E3ClimateZone (in that order).
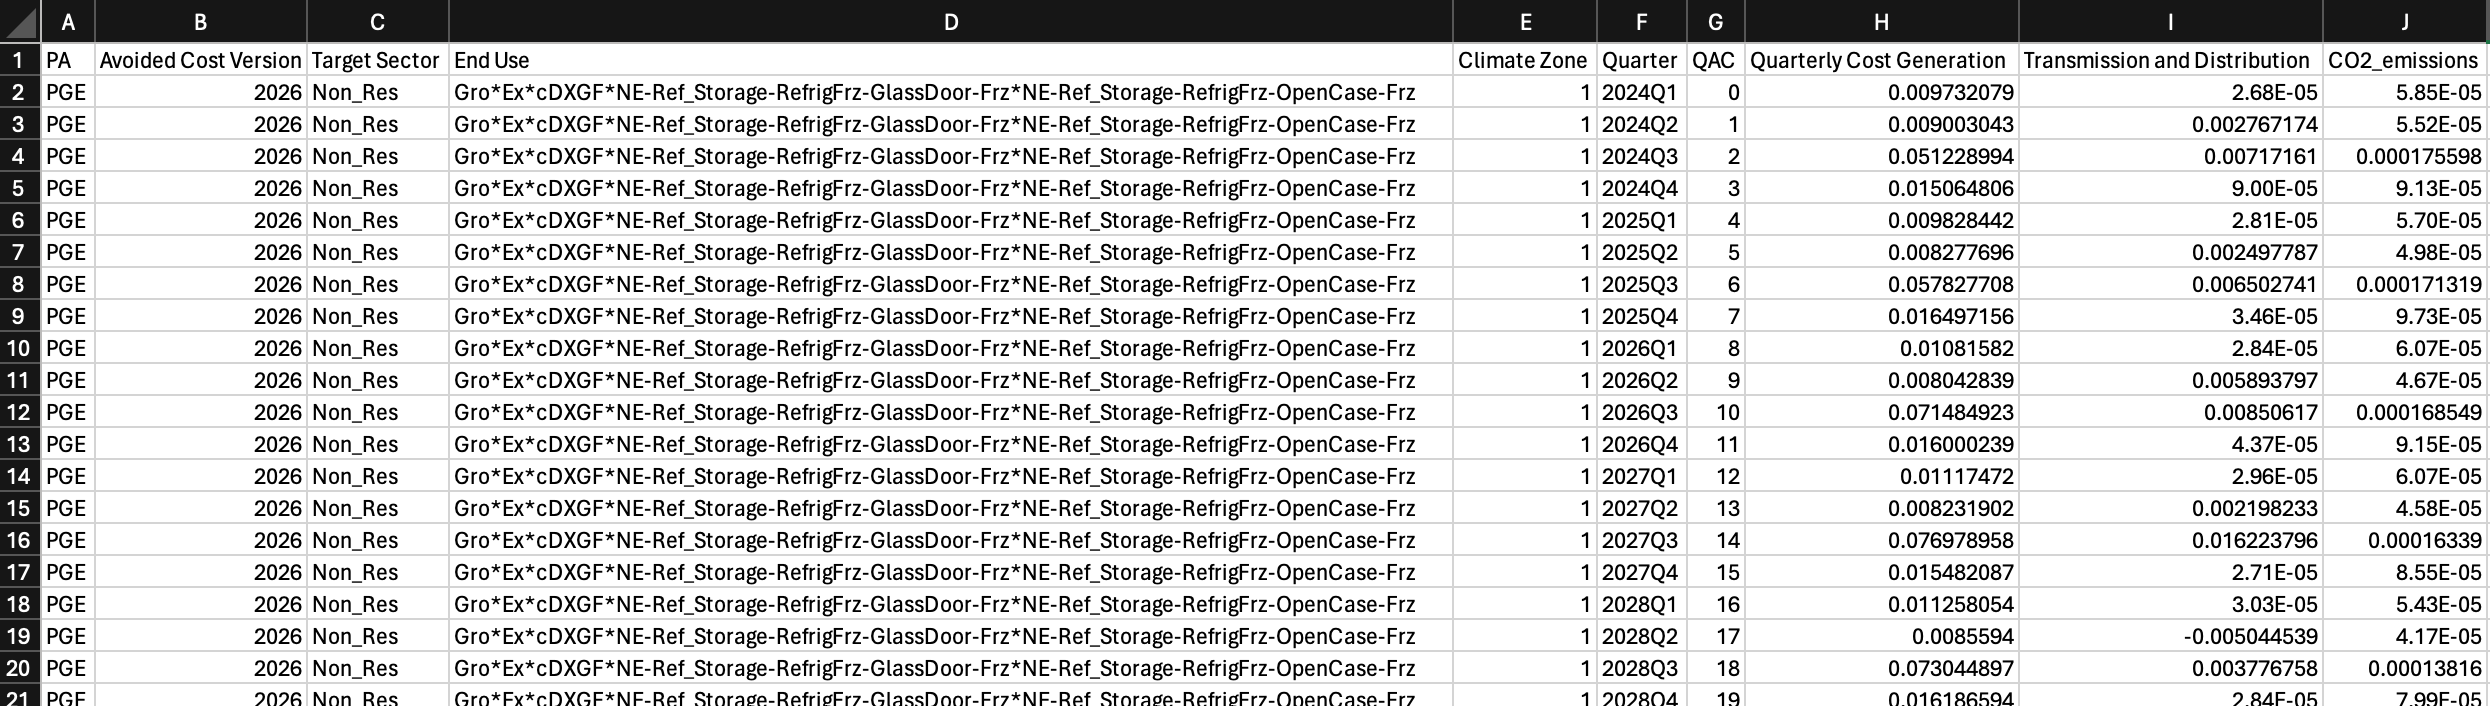
The avoided cost file includes the IOU_AC_Territory, E3TargetSector, E3MeaElecEndUseShape, and E3ClimateZone broken out into individual fields, as well as the quarter and the generation costs and transmission and distribution costs. Quarterly CO2 emissions reduction numbers are also included. Note the screen grab below omits the fields for the generation and transmission and distribution costs for the societal cost tests; those fields are in the files farther to the right of the fields shown below.
How to inspect the load shapes that were used to generate the impact profile
If you are viewing an impact profile and wish to look at the load shapes that were used to generate it you can copy the TechID from the impact profile ID.
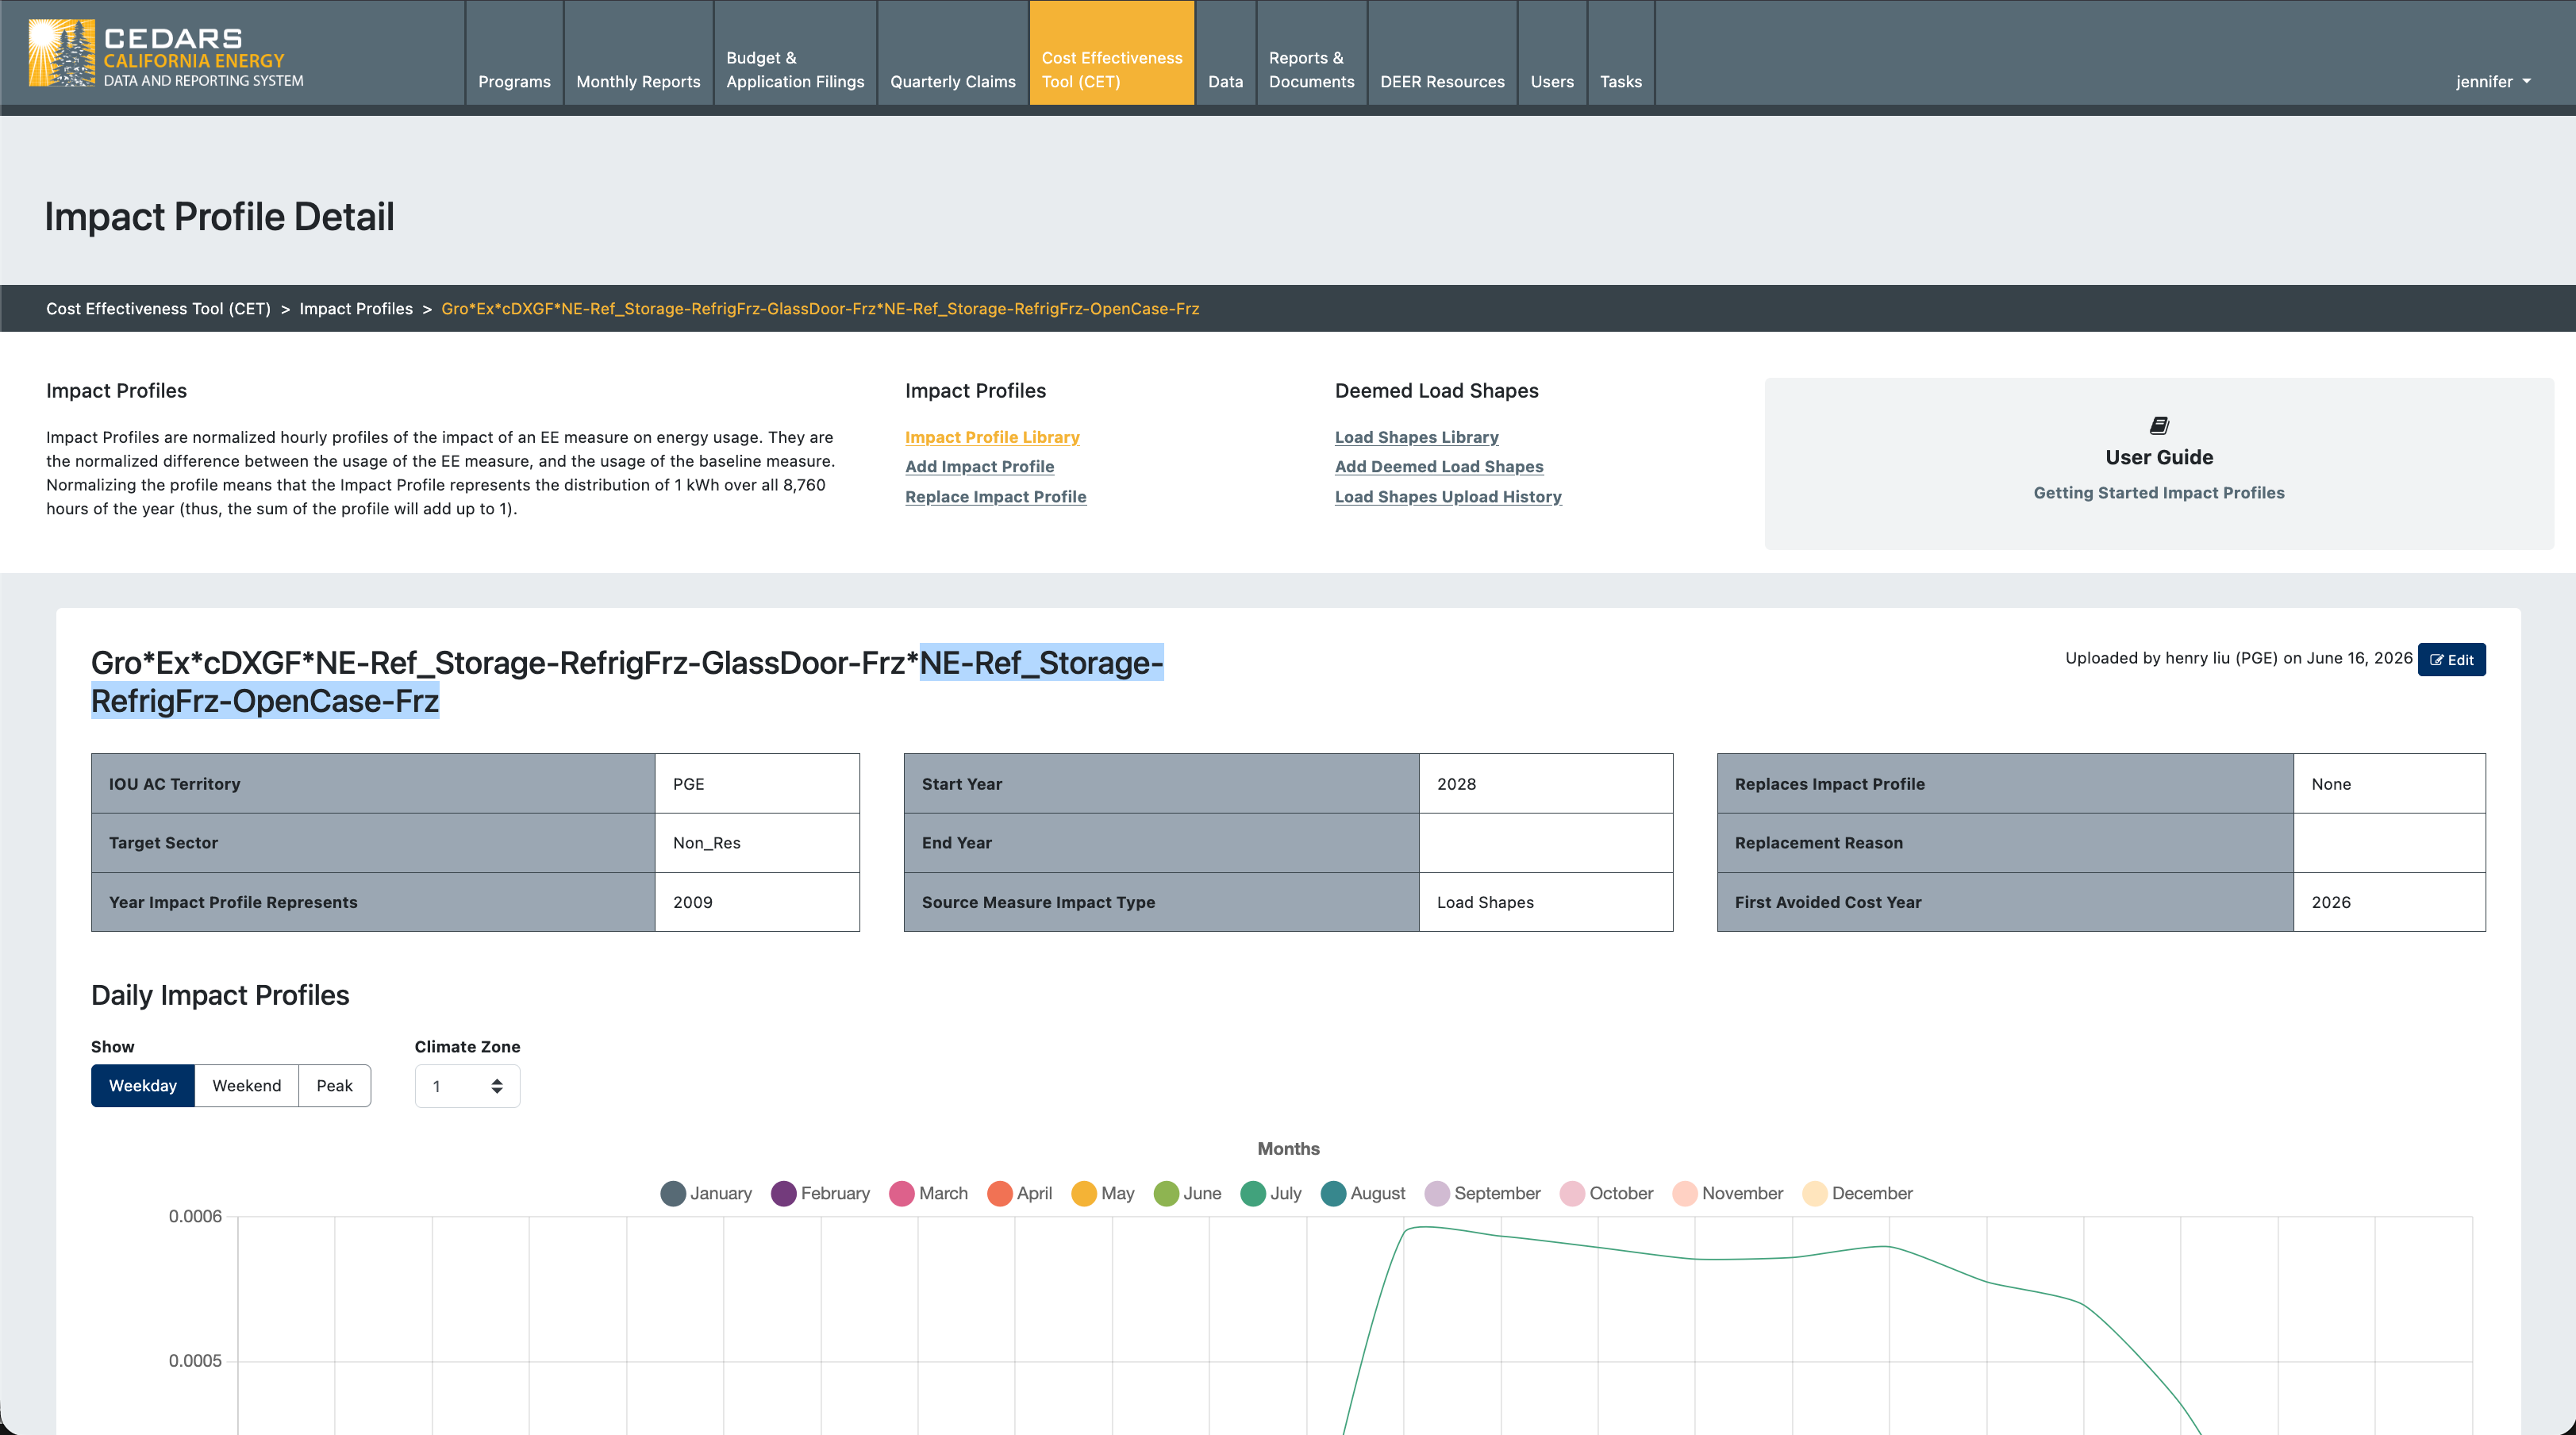
However you get to the TechID, once you have it you can paste it (or type it) into the search in the load shape library page.
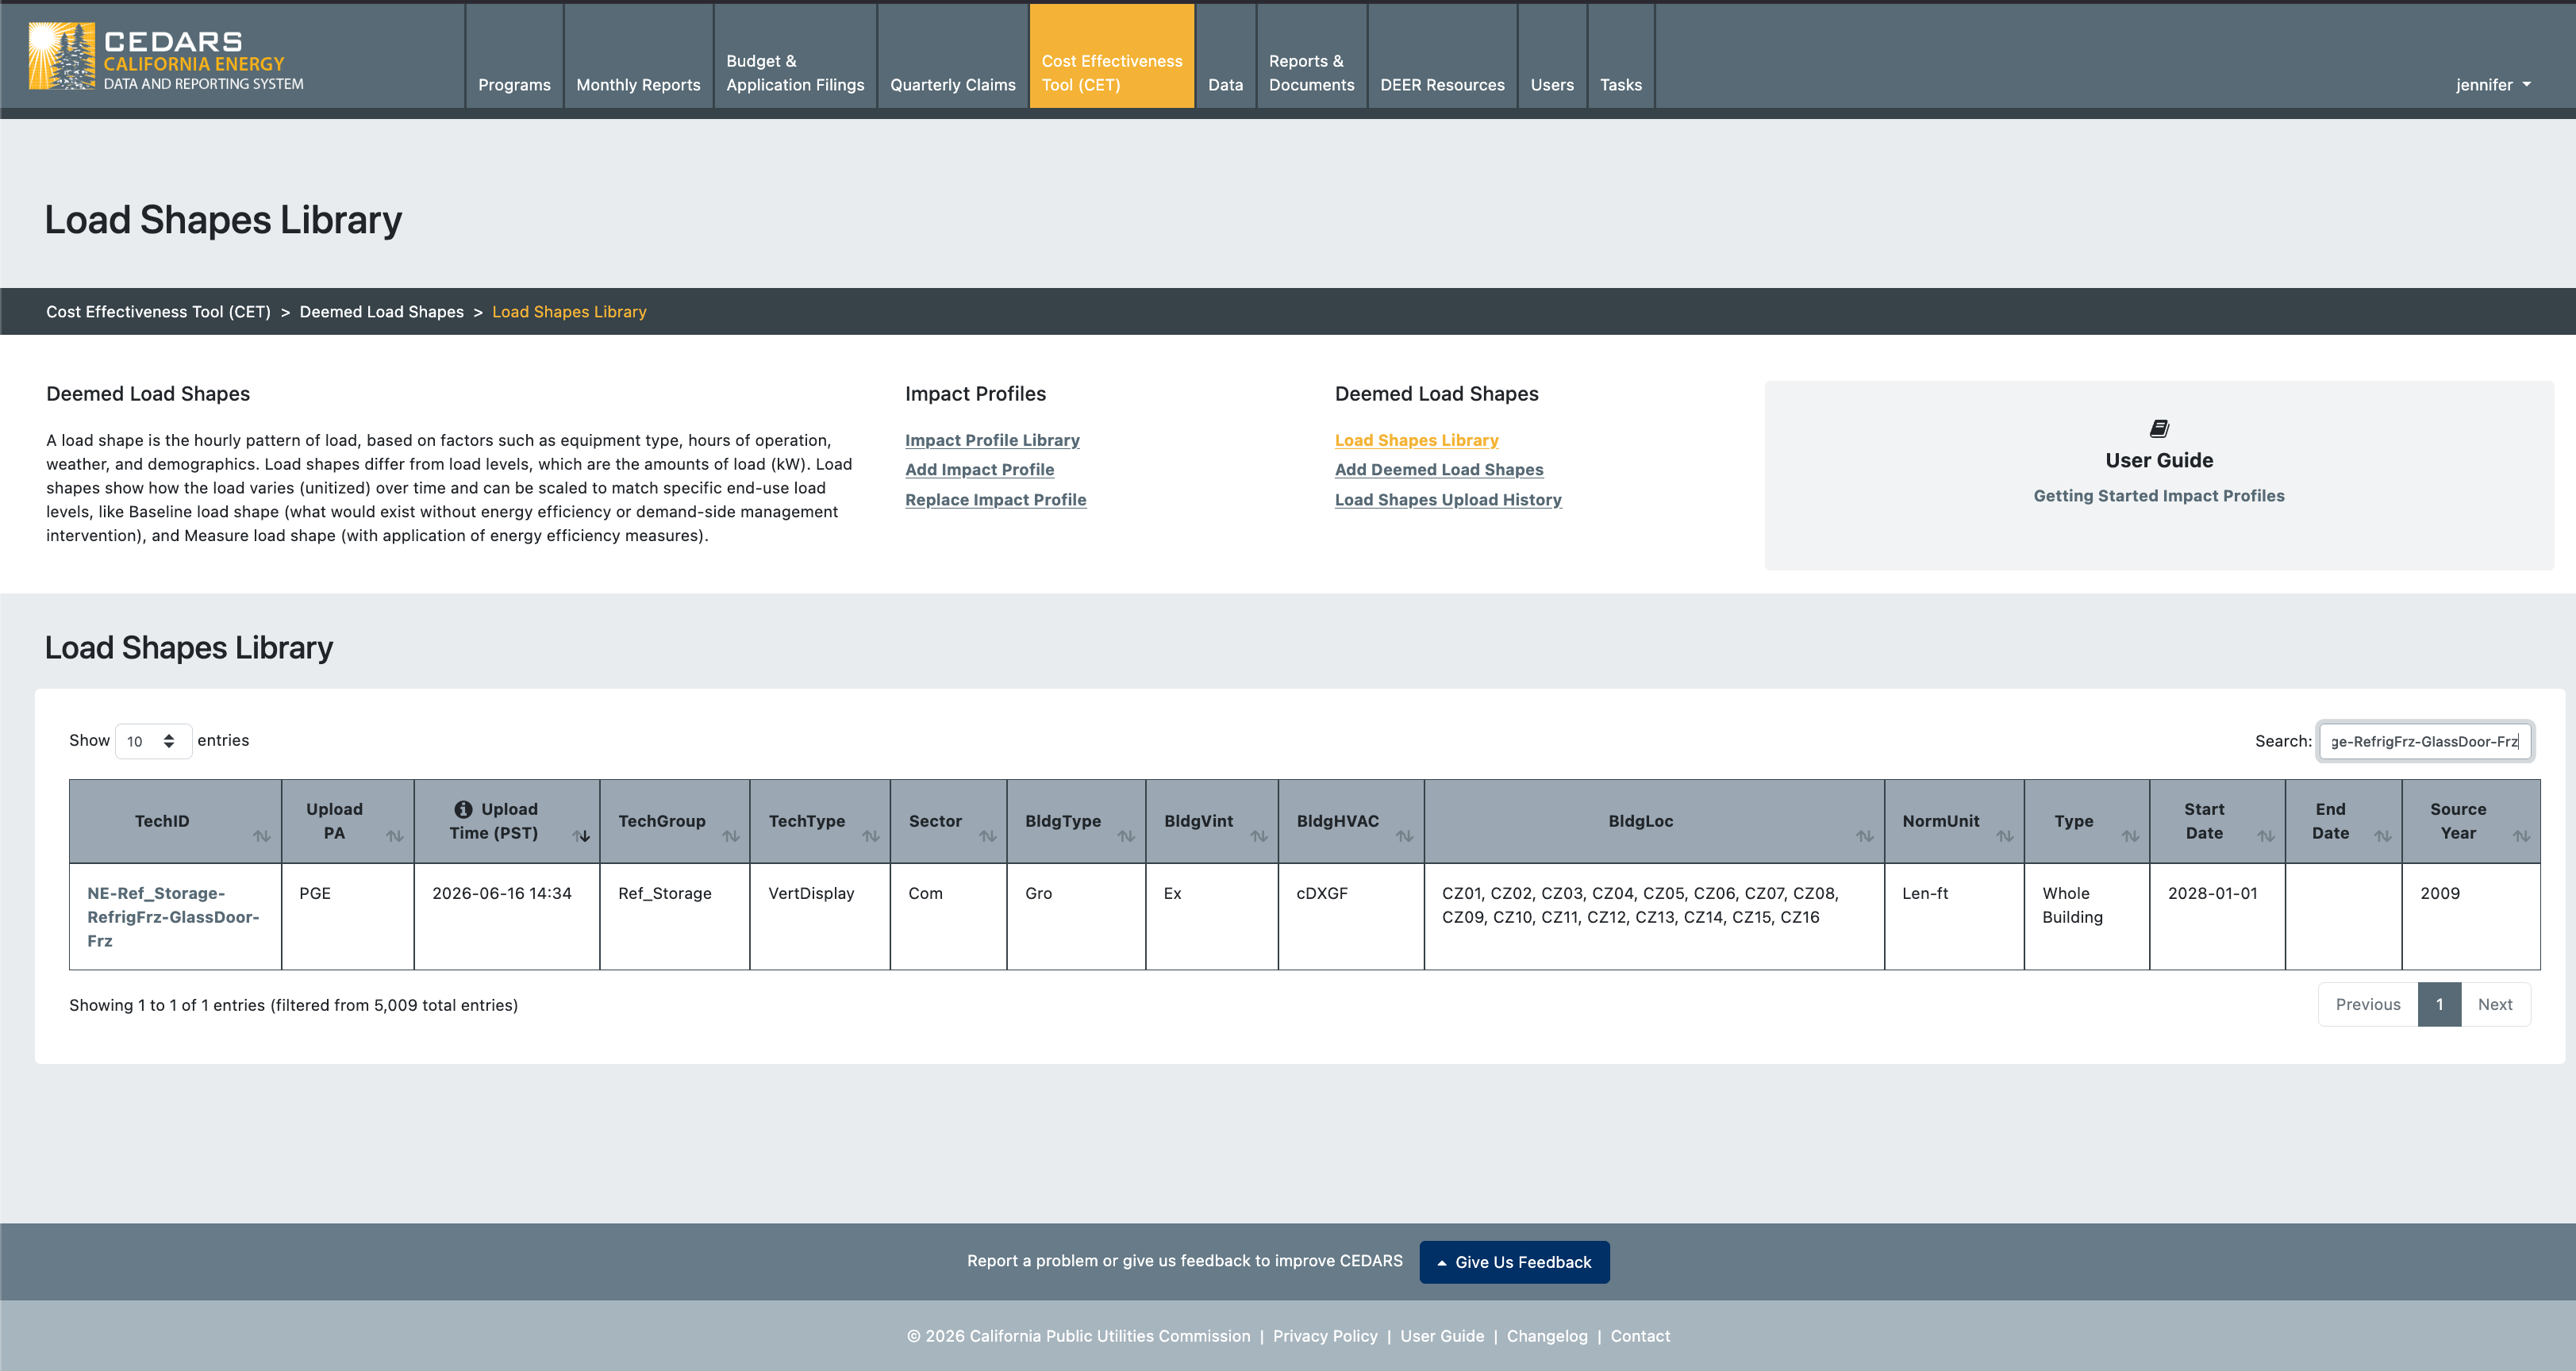
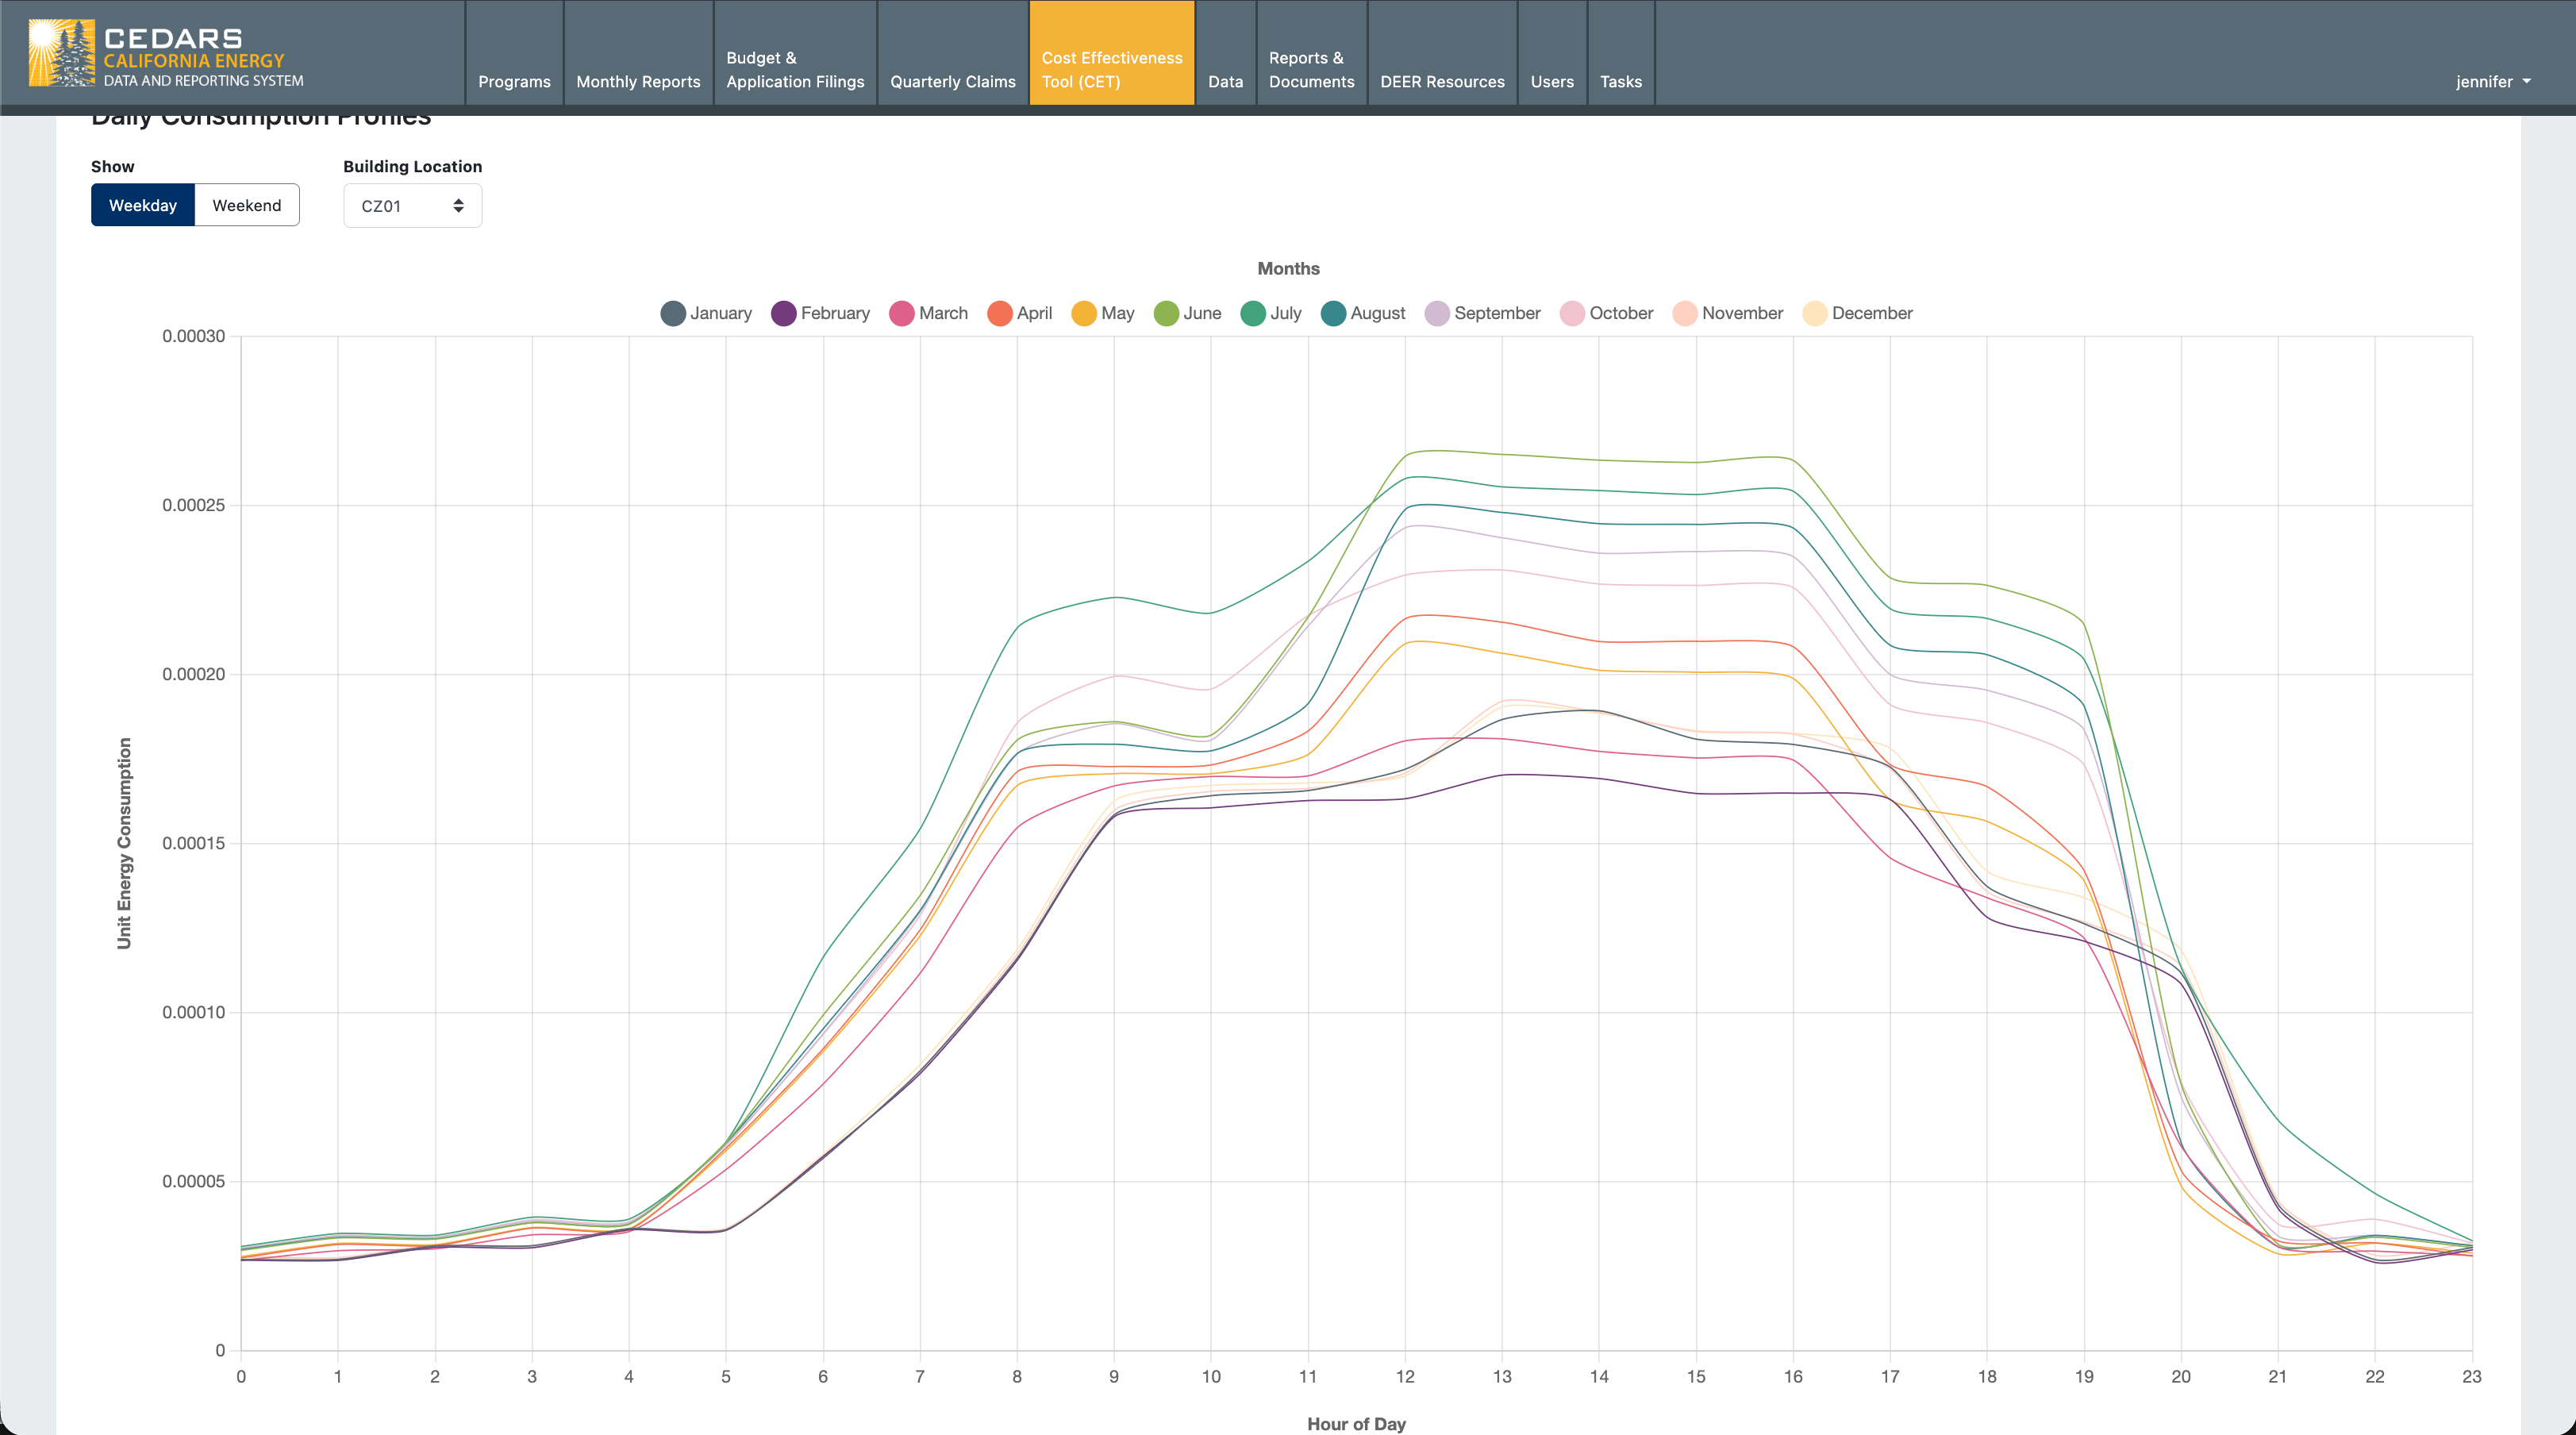
In the filtered list of load shapes, click on the TechID to view its details. You can also view the load shape data in CEDARS, e.g.
You can then do the same steps to search for the base TechID
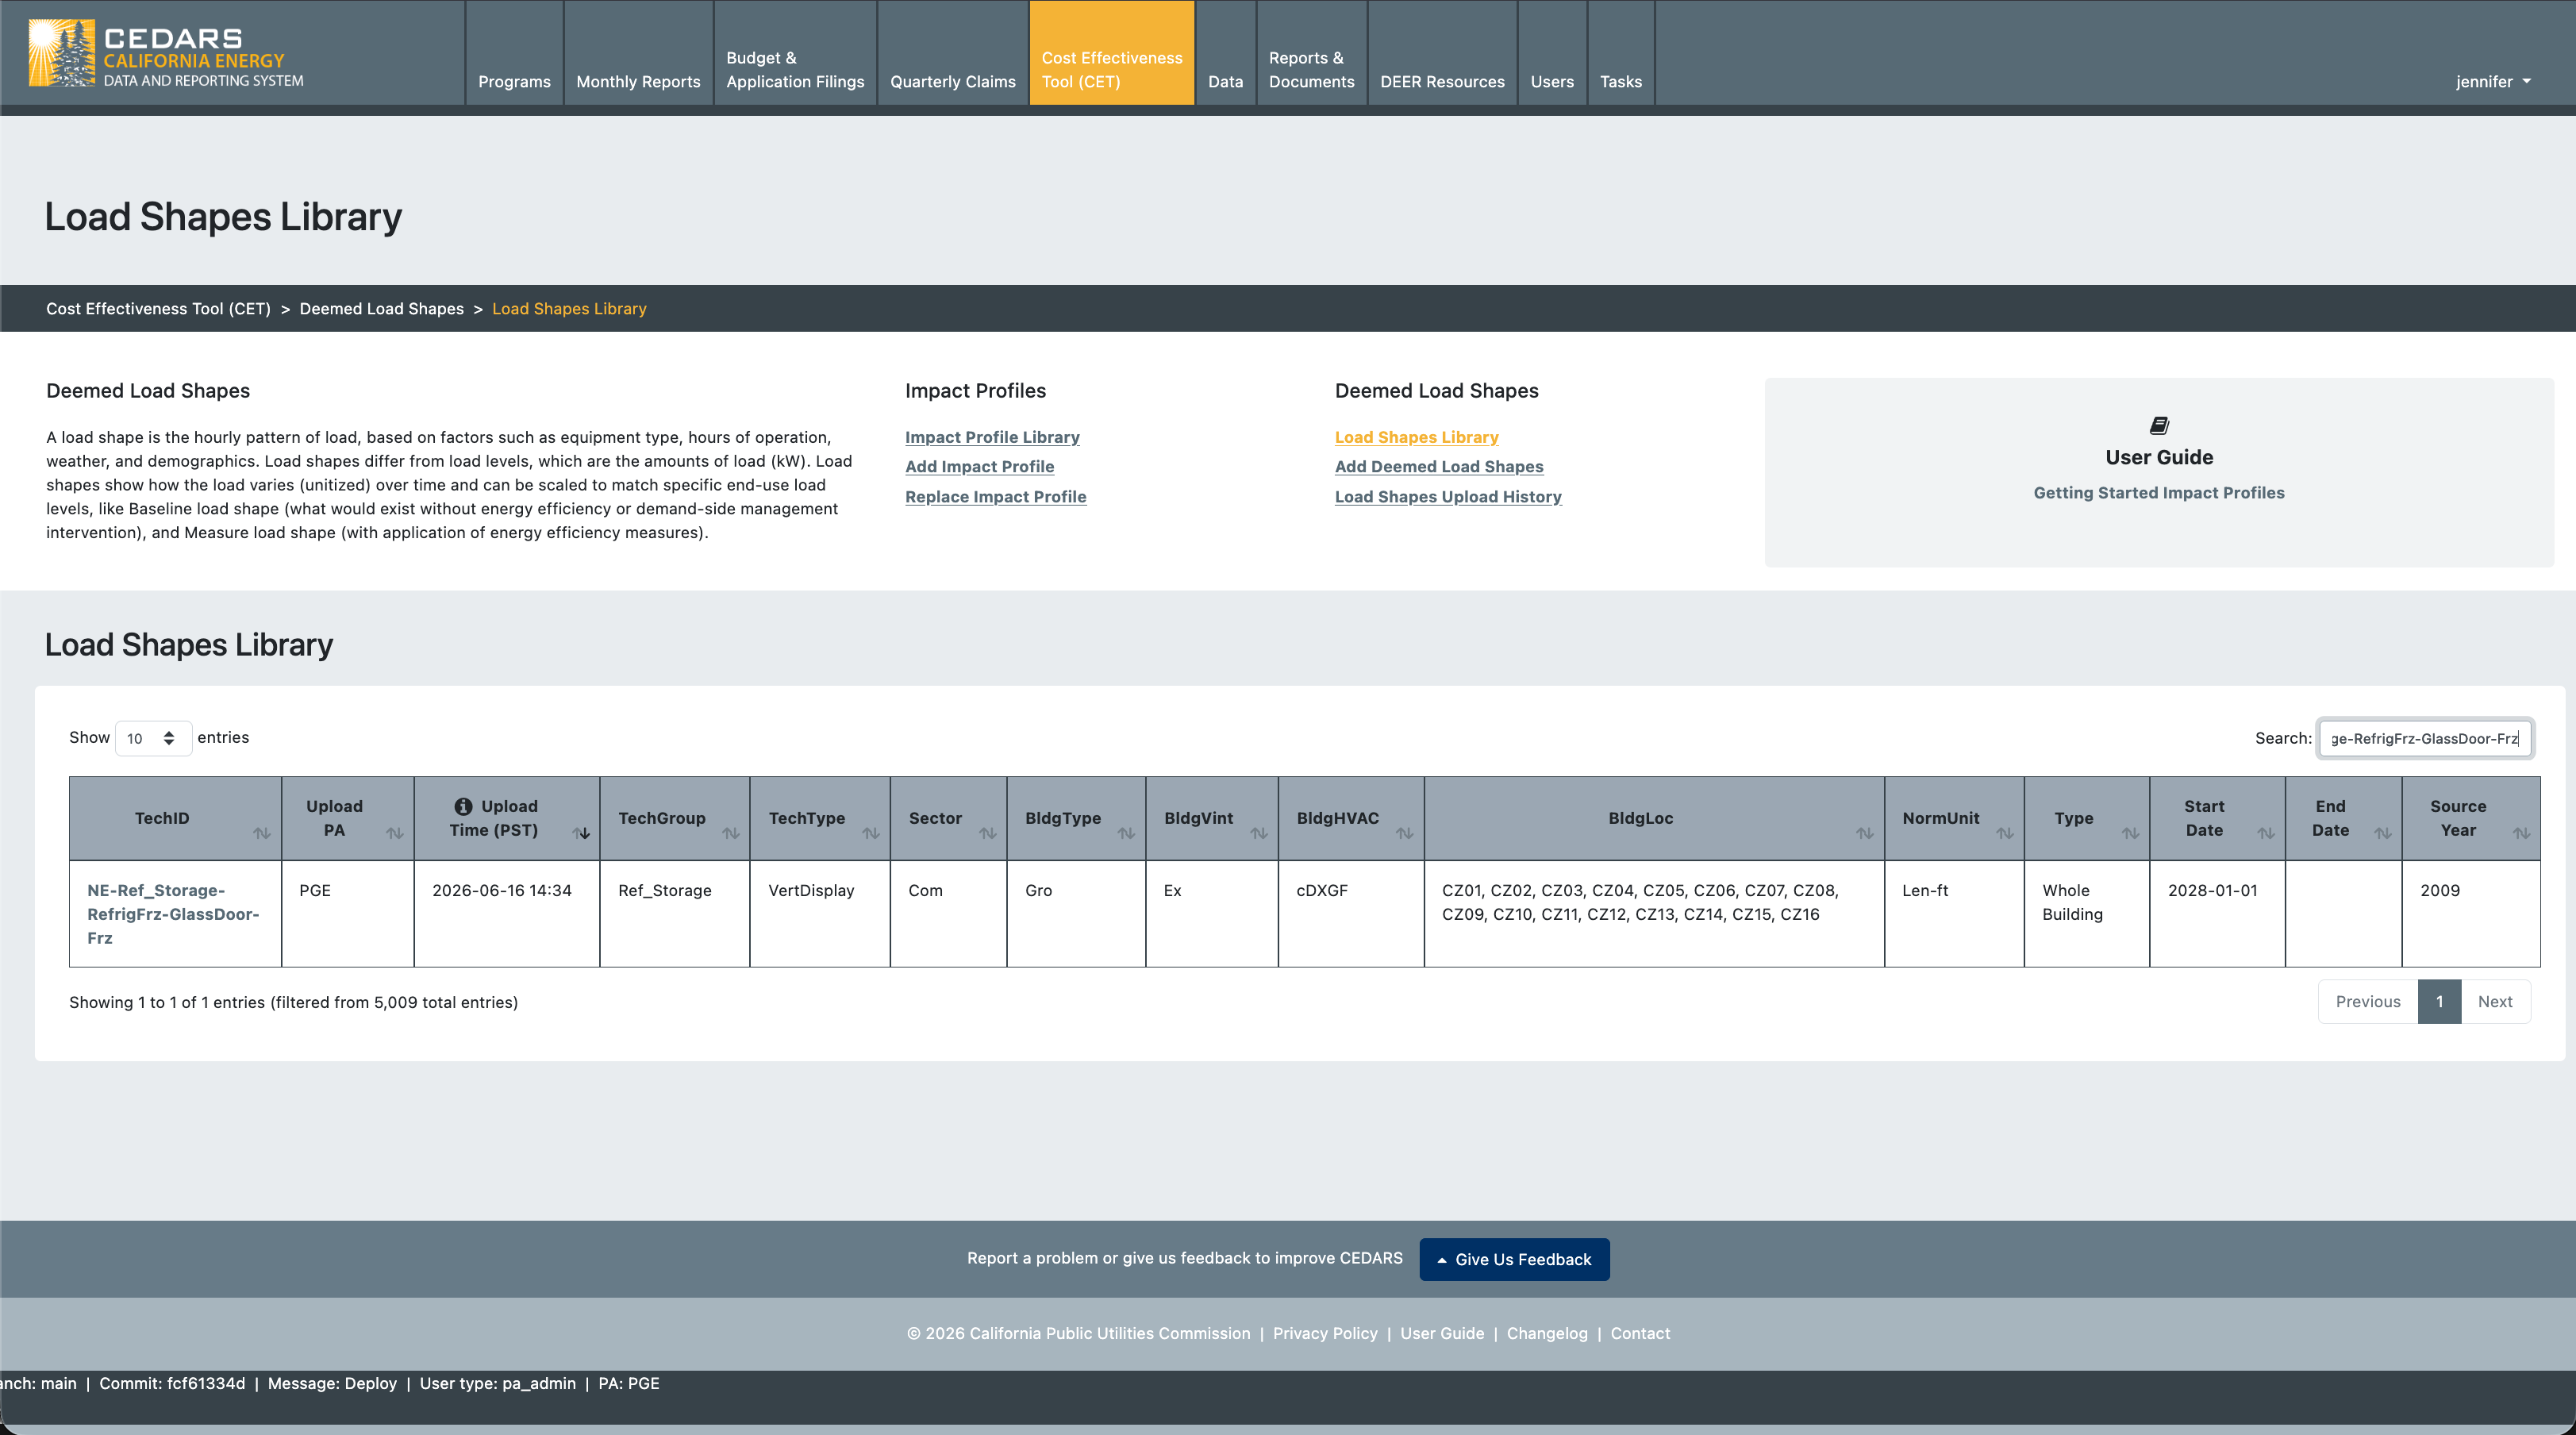
and view that load shape in CEDARS, e.g.
Was this helpful?
Still need help? Ask the team