Data & Documents - Navigation Changes & New Dashboard
Navigation Updates
We've made updates to the CEDARS navigation to enhance your experience and simplify access to key dashboards. Here's what you need to know:
What's Changed?
“Data” Tab - Relocation and Renaming of Pages:
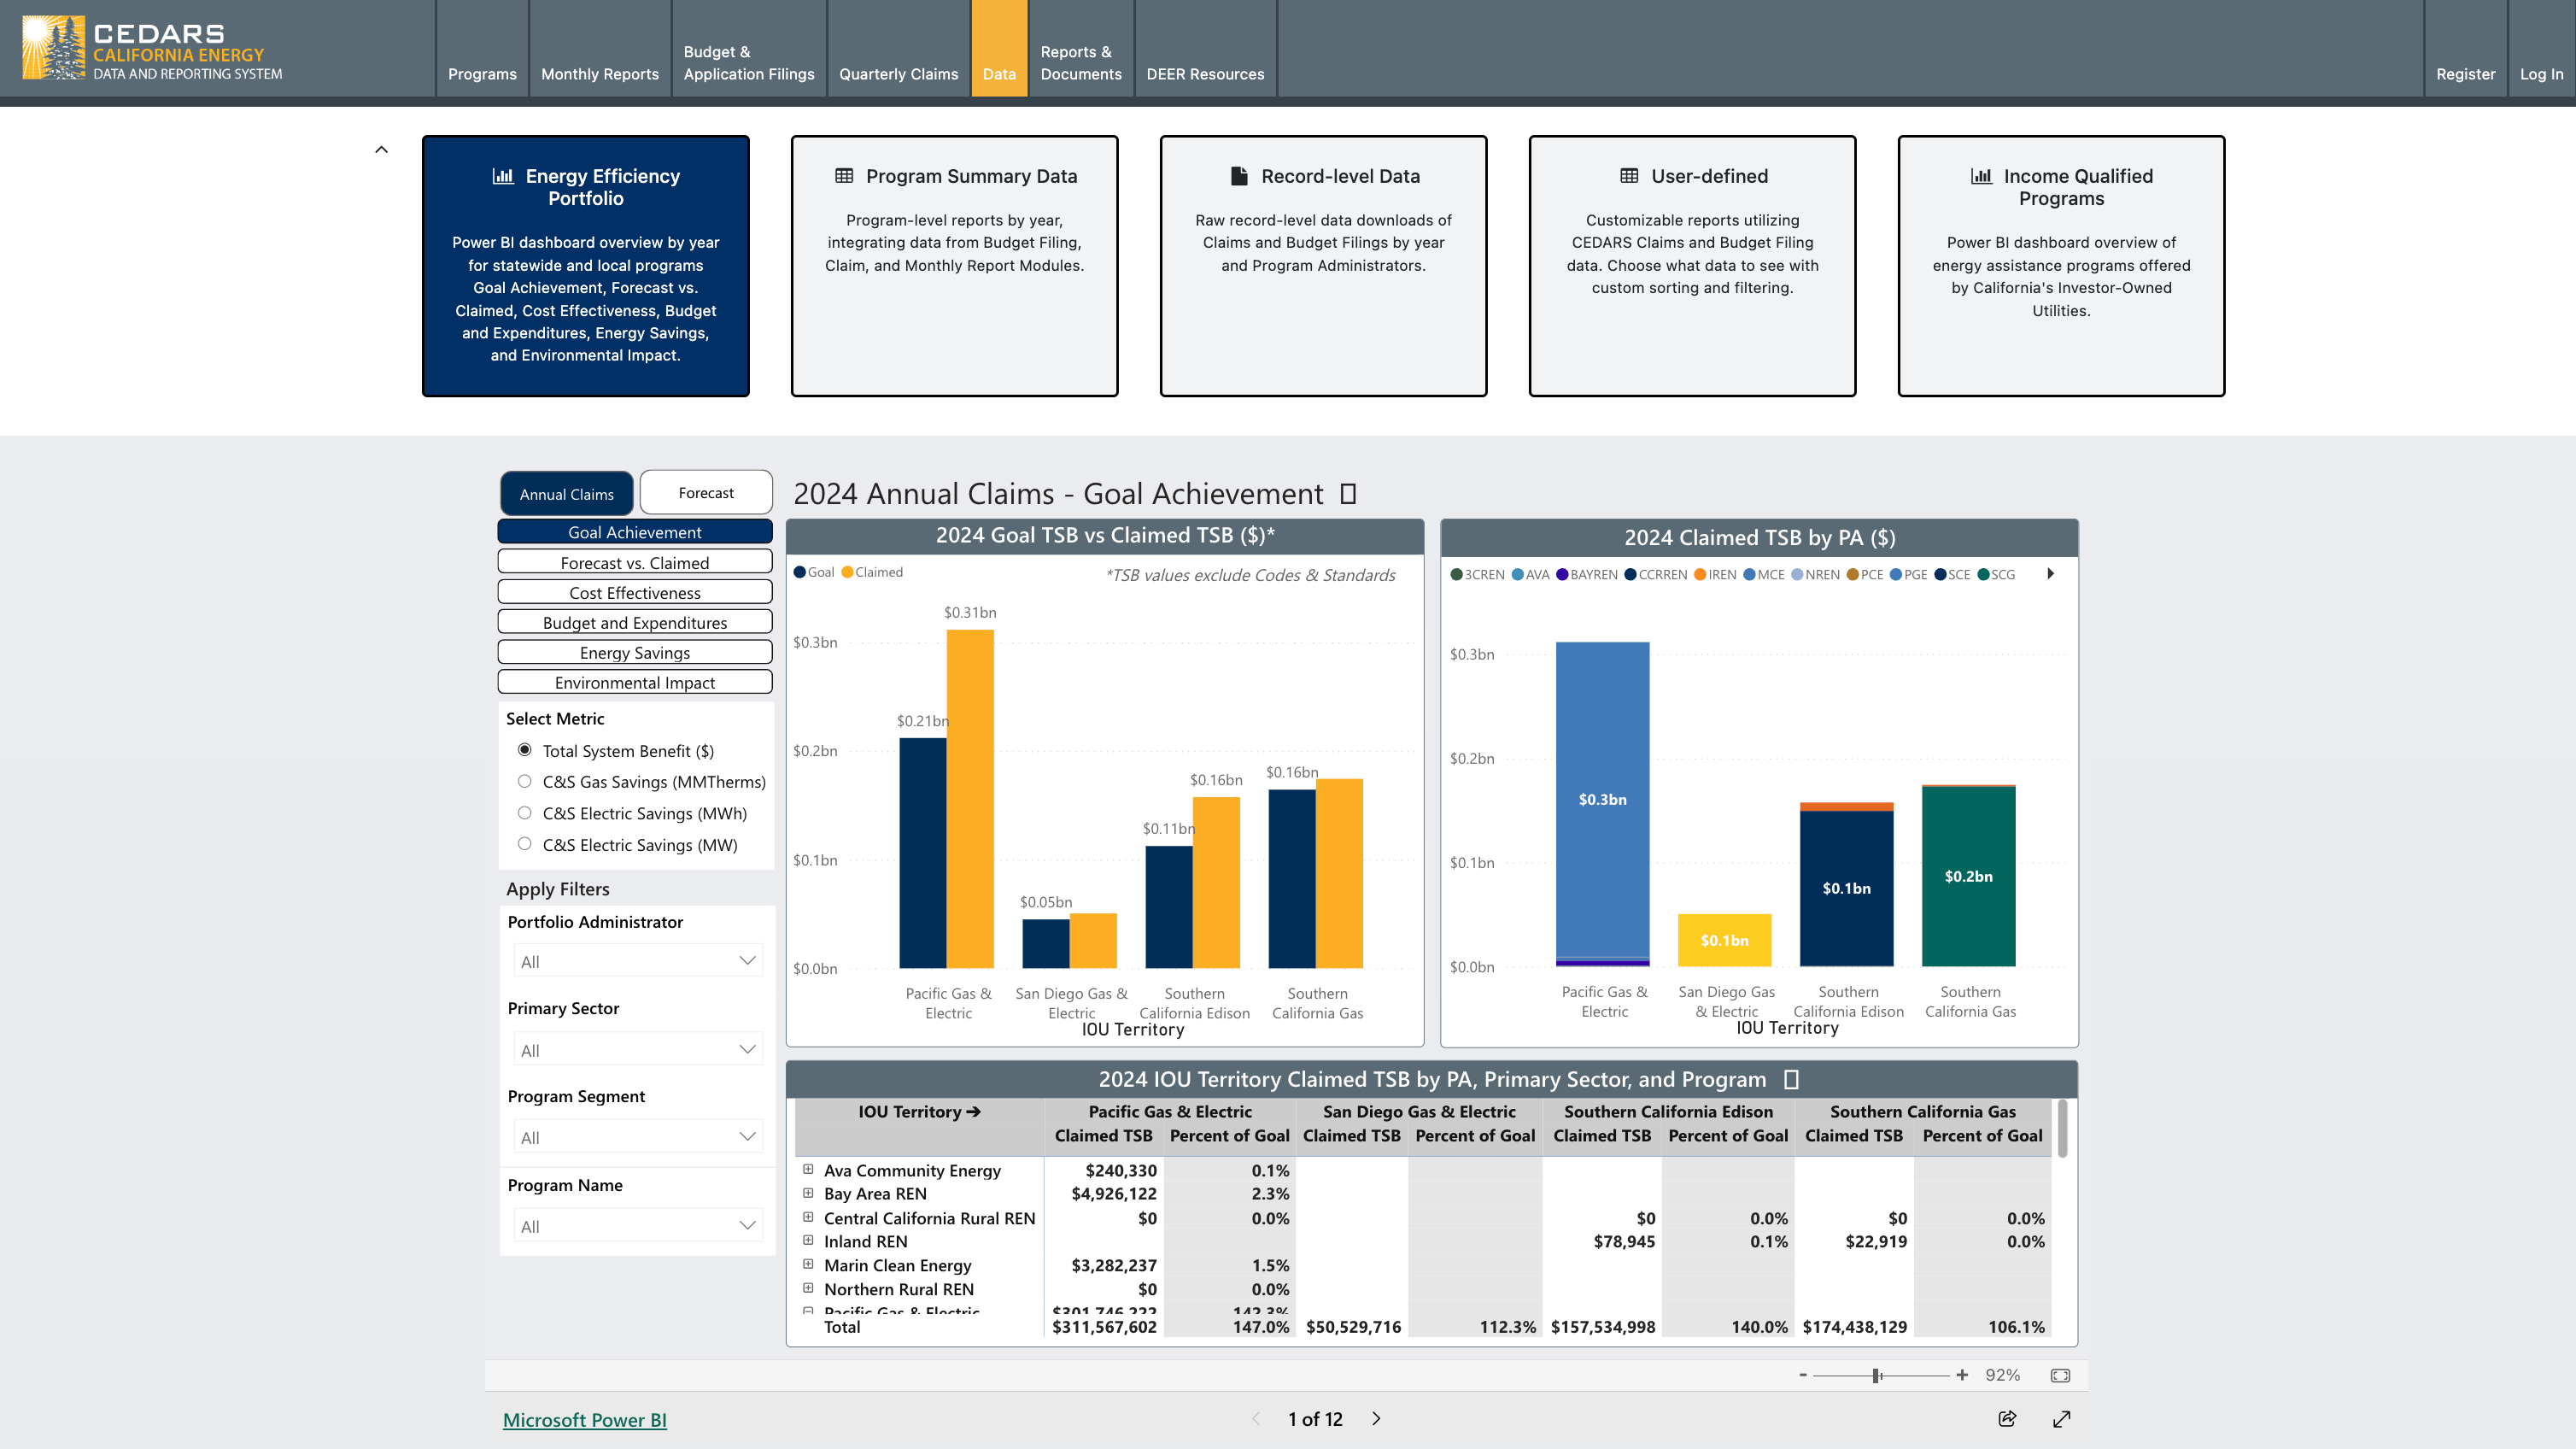
The "Data" tab on the top navigation bar provides a comprehensive view of California’s energy efficiency portfolio through multiple dashboards and data tools.
The "Income Qualified Program Data" tab has been relocated to a page in the "Data" tab as "Income Qualified Programs".
The “Summary” page has been renamed to “Program Summary Data”.
The "Record-level Downloads" page has been renamed to “Record-level Data”.
The “Documents” tab has been renamed to “Reports & Documents”.
We have added new “Energy Efficiency Portfolio” page.
Why Are We Making These Changes?
We aim to enhance usability by consolidating related features into one accessible location. This update will streamline navigation, making it easier for you to find tools and information more efficiently.
New “Energy Efficiency Portfolio” Dashboard
Annual Claims
As part of Phase 1, this dashboard includes 2024 data only.

The dashboard provides a detailed and interactive analysis of statewide and local program performance, focusing on six key areas:
Goal Achievement
Forecast vs. Claimed
Cost Effectiveness
Budget and Expenditures
Energy Savings
Environmental Impact
The dashboard provides straightforward insights to help users gauge program efficiency, environmental results, and financial management.

Goal Achievement offers a clear view of each Investor-Owned Utility’s (IOU) progress toward its targets. The dashboard highlights goal attainment (Claimed vs. Goal) and the percentage achieved across key metrics: Total System Benefit, Electric Savings, Gas Savings, and Total Expenditures. It enables quick comparison of actual results against targets and helps track overall performance.

The Forecast vs. Claimed view compares what was projected in each PA’s budget application with what was actually delivered. Users can quickly see variances across Total System Benefit, Electric Savings (MWh), Electric Savings (MW), Gas Savings (MMTherms), and Total Expenditures. This view highlights where programs are outperforming, meeting, or falling short of forecasts

The Cost Effectiveness view provides key indicators such as the Total TRC Ratio, Total PAC Ratio, and Total RIM Ratio, enabling users to assess the overall efficiency and impact of programs. By analyzing these ratios, stakeholders can identify opportunities to optimize resource allocation and maximize program benefits.

The Budget and Expenditures view provides key indicators such as Filed Budget and Total Expenditures Claimed. In addition to high-level metrics, users can view a breakdown of Total Expenditures including Direct Implementation Costs, Rebates and Incentives, Admin Costs, Marketing Outreach, EMV, and Costs Recovered from Other Sources across different Implementer Types.

The Energy Savings view tracks critical data points, including kWh Savings, Therm Savings, and kW Savings. These metrics provide a comprehensive view of energy conservation trends, helping to pinpoint areas where initiatives have successfully reduced consumption and identifying where additional efforts may be needed.

In the area of Environmental Impact, the dashboard provides insights into pollutants such as CO2, PM10, and NOx. This data helps measure the environmental benefits of programs, offering a quantitative basis for evaluating their contribution to cleaner air and a healthier ecosystem.
By combining these robust data points, the dashboard provides an intuitive yet comprehensive tool for stakeholders to evaluate and enhance program performance across multiple dimensions, driving sustainable and impactful outcomes.
Forecast
As part of Phase 2, this dashboard includes 2024-2027 data only.

Introduces multi-year visibility into program planning by incorporating 2024–2027 forecasted annual targets. The dashboard provides a comprehensive view of projected performance across six key areas:
Program Cycle Summary
Annual Targets
Budget & Cost Effectiveness
Budget Detail
Energy Savings
Environmental Impact
These visualizations allow users to understand expected outcomes over the full program cycle, evaluate planned budgets and cost effectiveness, and track anticipated savings and environmental benefits.

The Program Cycle Summary provides a high-level view of projected performance over the full 2024–2027 cycle. It includes Program Cycle TSB Goals, TSB Forecasts, and Budget Forecasts, along with Program Cycle IOU Territory TSB Forecasts by PA. This view helps users assess whether long-term forecasts align with statewide goals and planned budgets.

The Annual Targets view compares each year’s TSB Target against the TSB Forecast, highlighting gaps or over-performance at a glance. It also includes IOU Territory TSB Forecasts by PA, offering a clearer picture of how annual expectations vary across service territories.

Budget & Cost Effectiveness presents Annual TSB Forecasts alongside Budget Forecasts to show how projected benefits relate to planned spending. It also includes Annual Cost Effectiveness Forecasts and program-level CE data, enabling users to evaluate expected value and efficiency across portfolios.

The Budget Detail view breaks down Total Budget by category and shows Budget allocation by portfolio segment as a percentage of the total. This helps users understand how funding is distributed and where major cost drivers sit within the forecast period.

The Energy Savings view provides forecasts for Electric Savings (kWh), Gas Savings (Therms), and Demand Savings (kW). These indicators allow users to track expected conservation outcomes and compare projected savings across technologies and portfolios.

The Environmental Impact view includes forecasted CO₂, PM10, and NOx reductions, expressed in metric tons. Program-level environmental impact forecasts are also included, giving users a clear understanding of anticipated air quality benefits associated with planned program activities.