Changelog

Follow new updates and improvements to Cedars.

June 29th, 2026

New

Impact Profiles

Load Shapes

Introduction of the PA Measure Developer User Type

This update introduces the PA Measure Developer user type in CEDARS, granting tailored permissions for adding load shapes and generating impact profiles, but restricting access to the other PA reporting submission tools.

Permissions Overview

  • Load Shape Library: Public access.

  • View Load Shape Graphs: Public access.

  • Add a New Load Shape: Accessible to PA Measure Developer, PA Ordinary, PA Admin.

  • Load Shape Upload History: Accessible to PA Measure Developer, PA Ordinary, PA Admin, with visibility restricted to their respective organizations.

Usage Instructions

Existing users interested in changing their role to PA Measure Developer should contact their team administrator or email cedars-team@sharperinfo.com to request the change.

June 26th, 2026

Fixed

CET

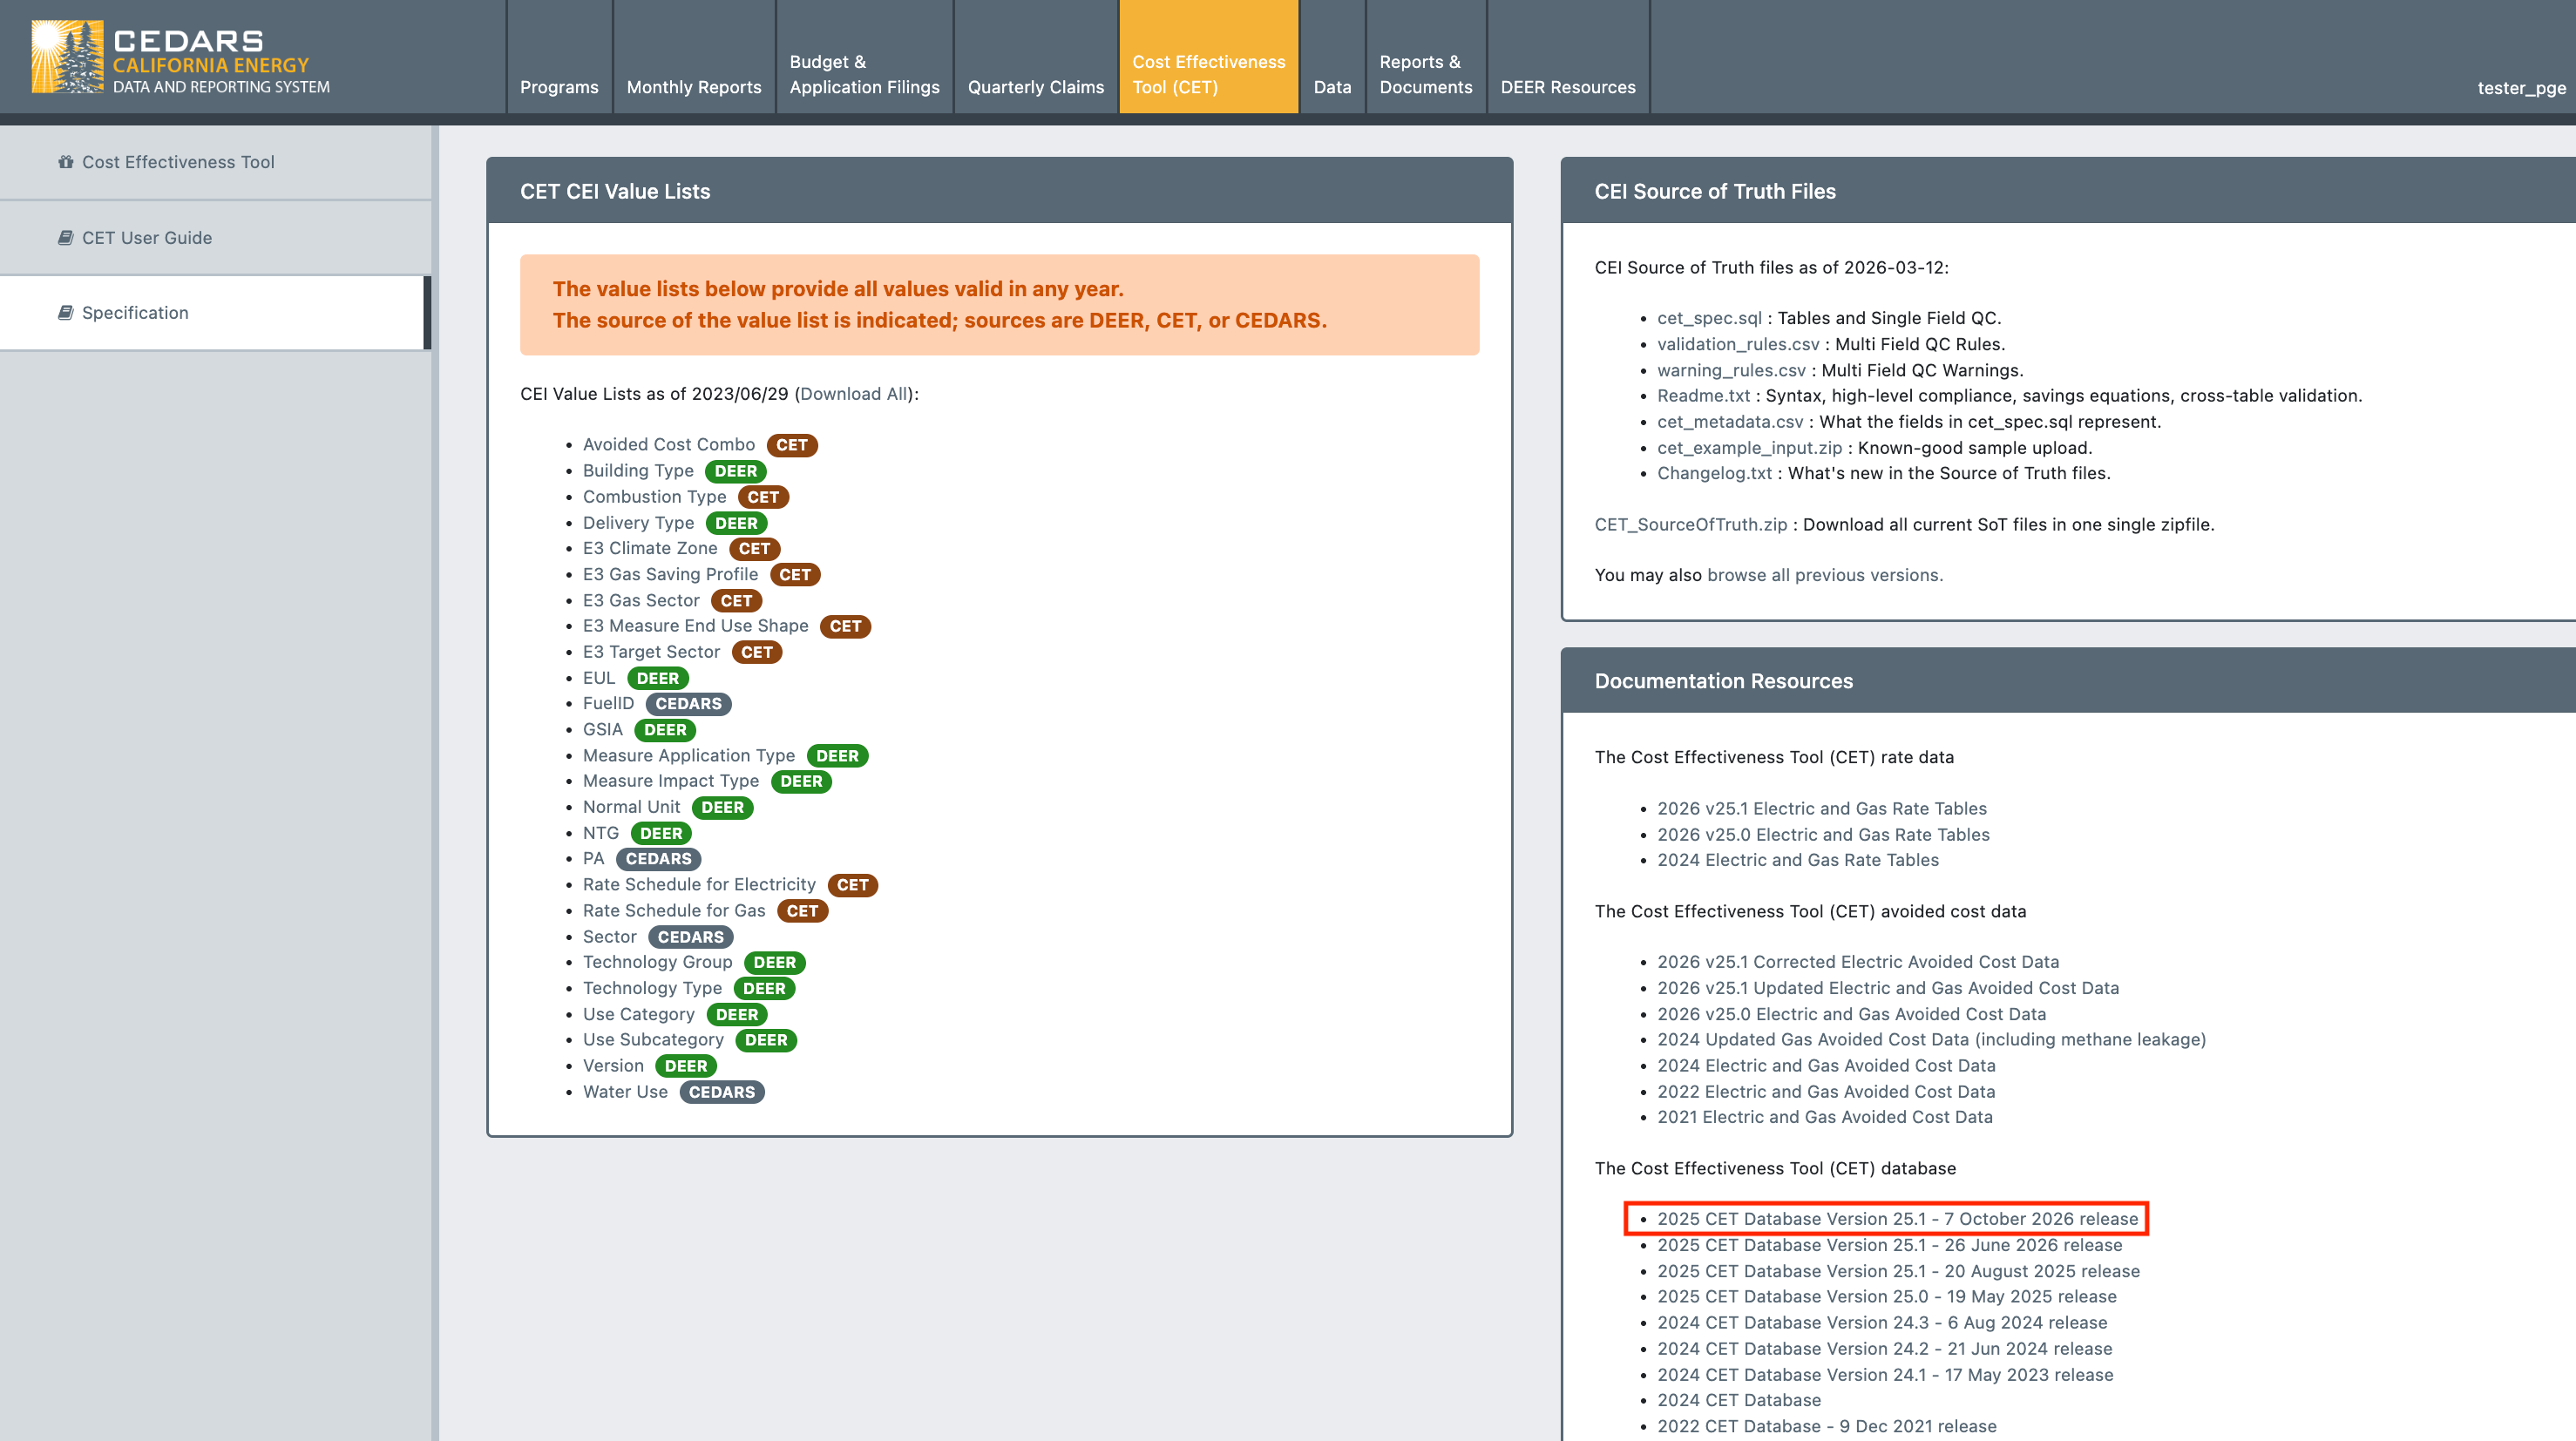
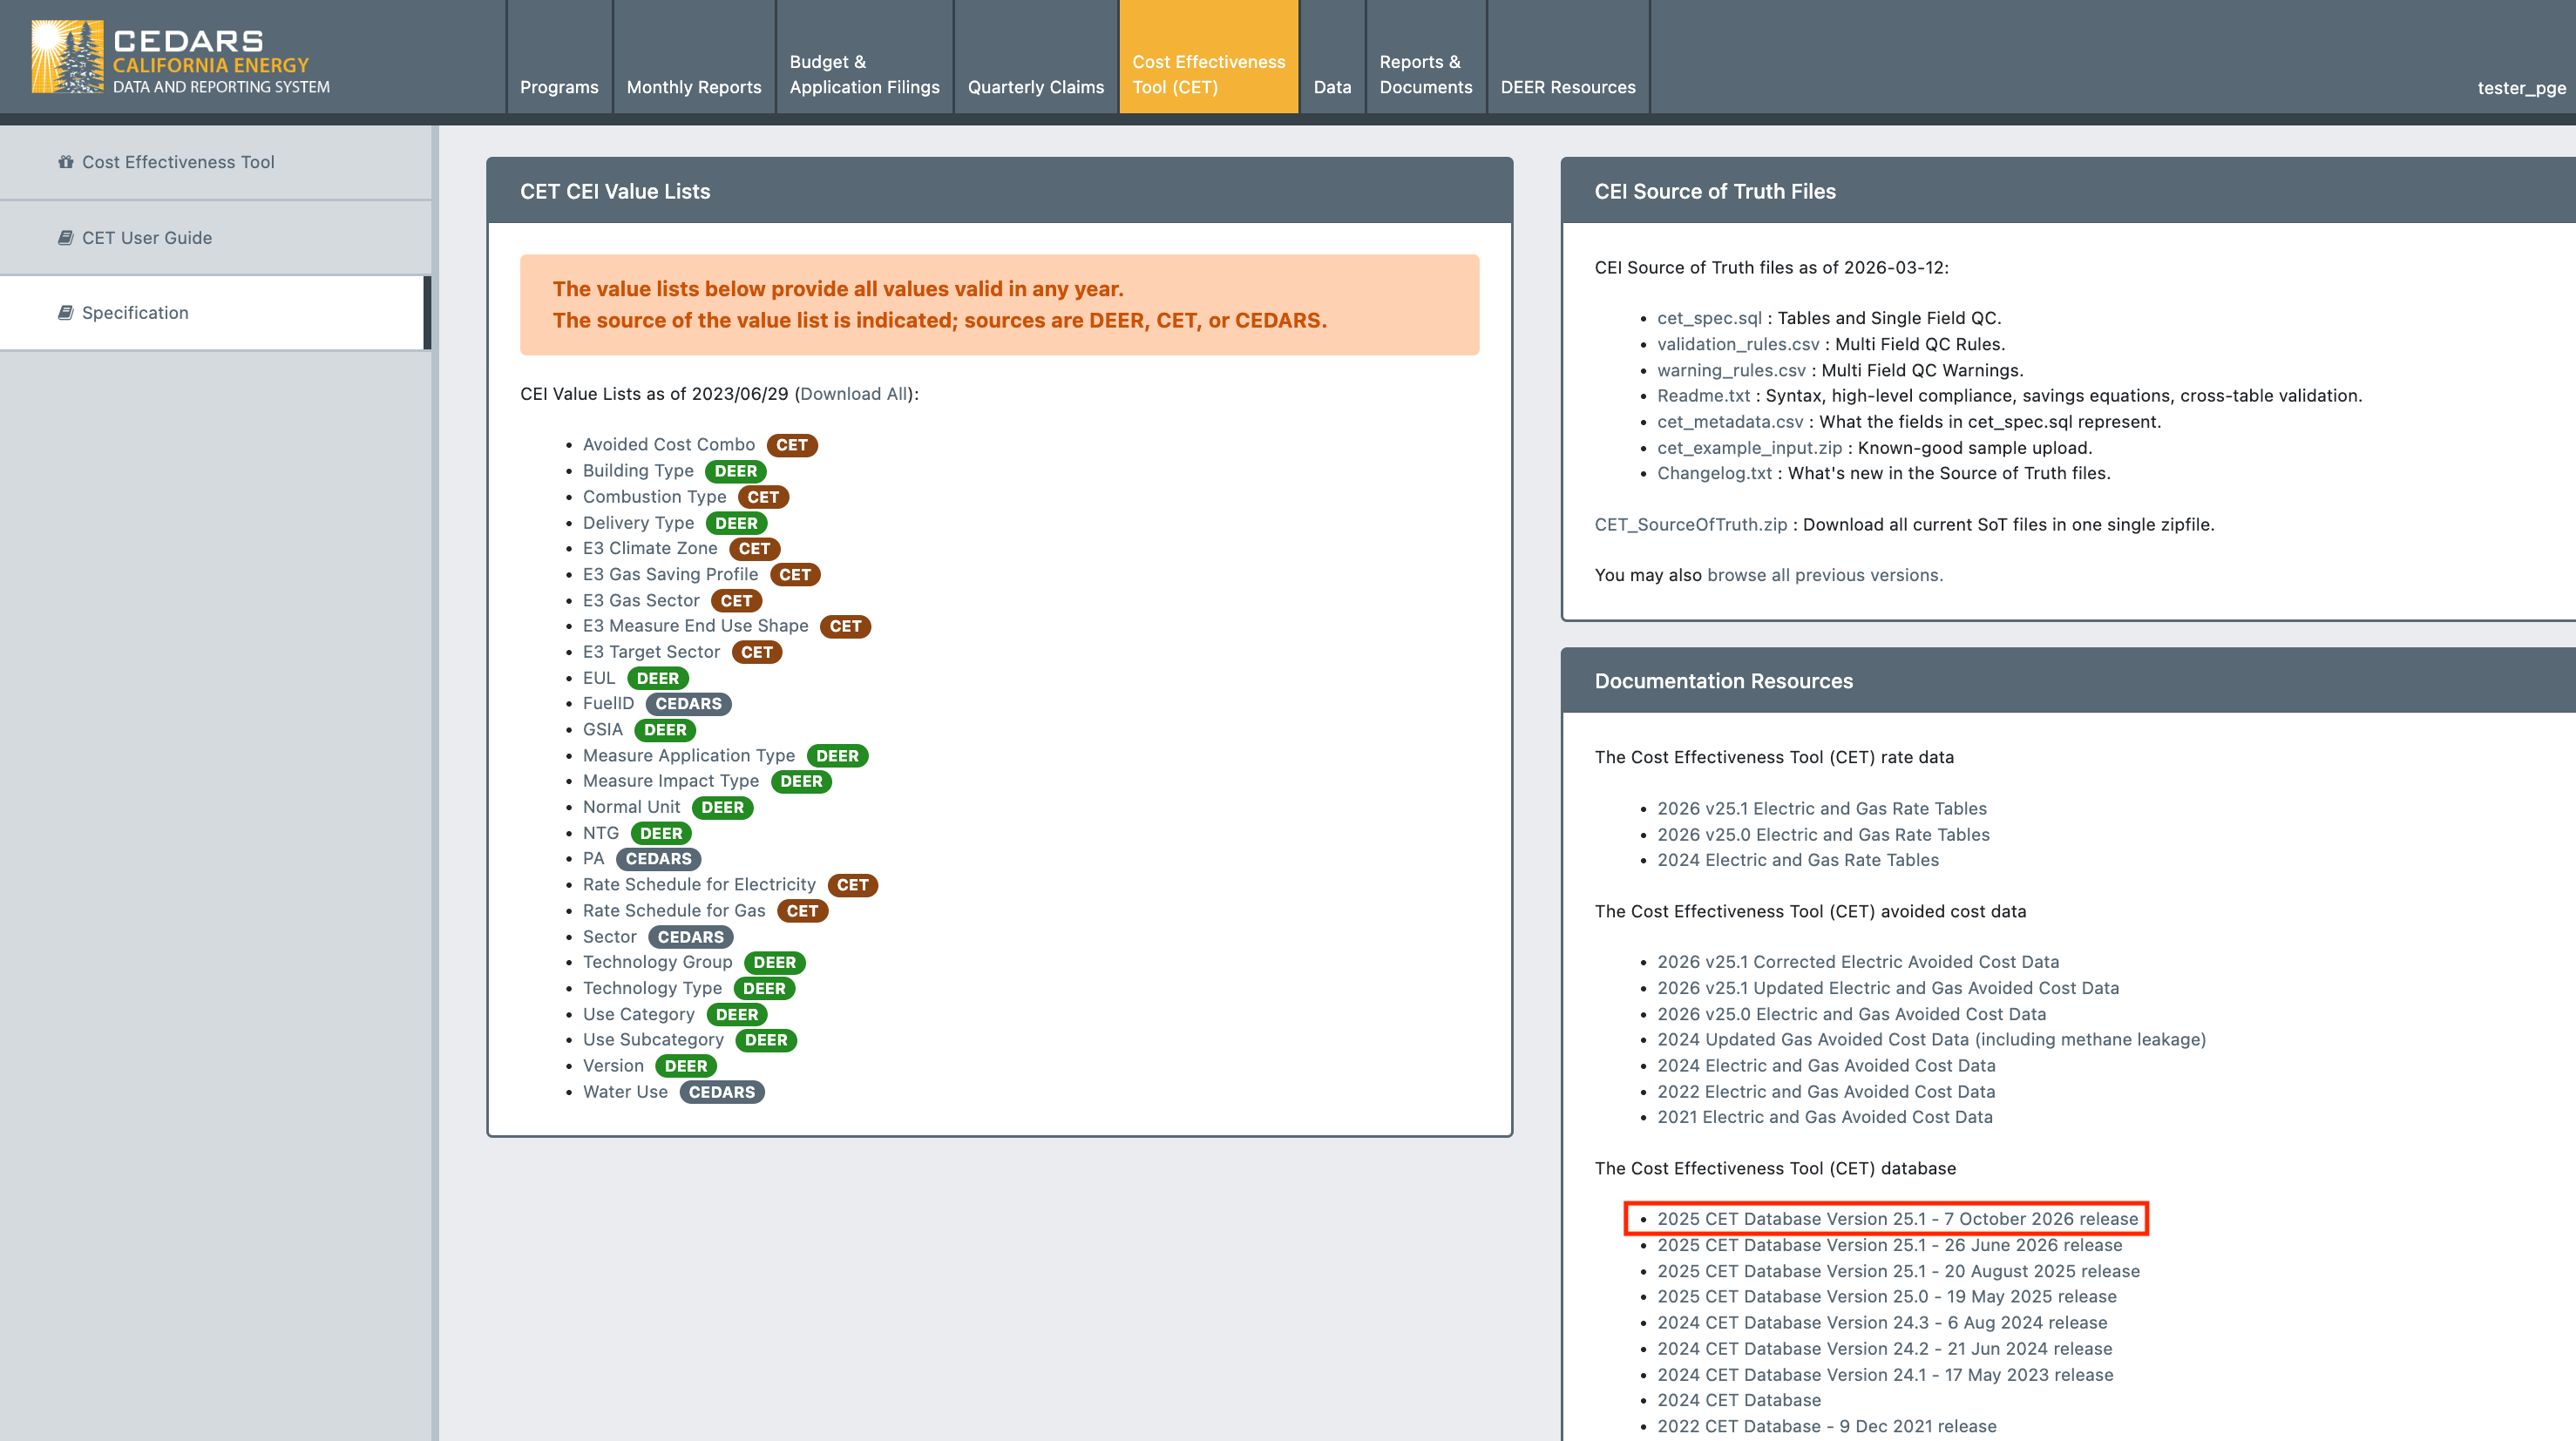
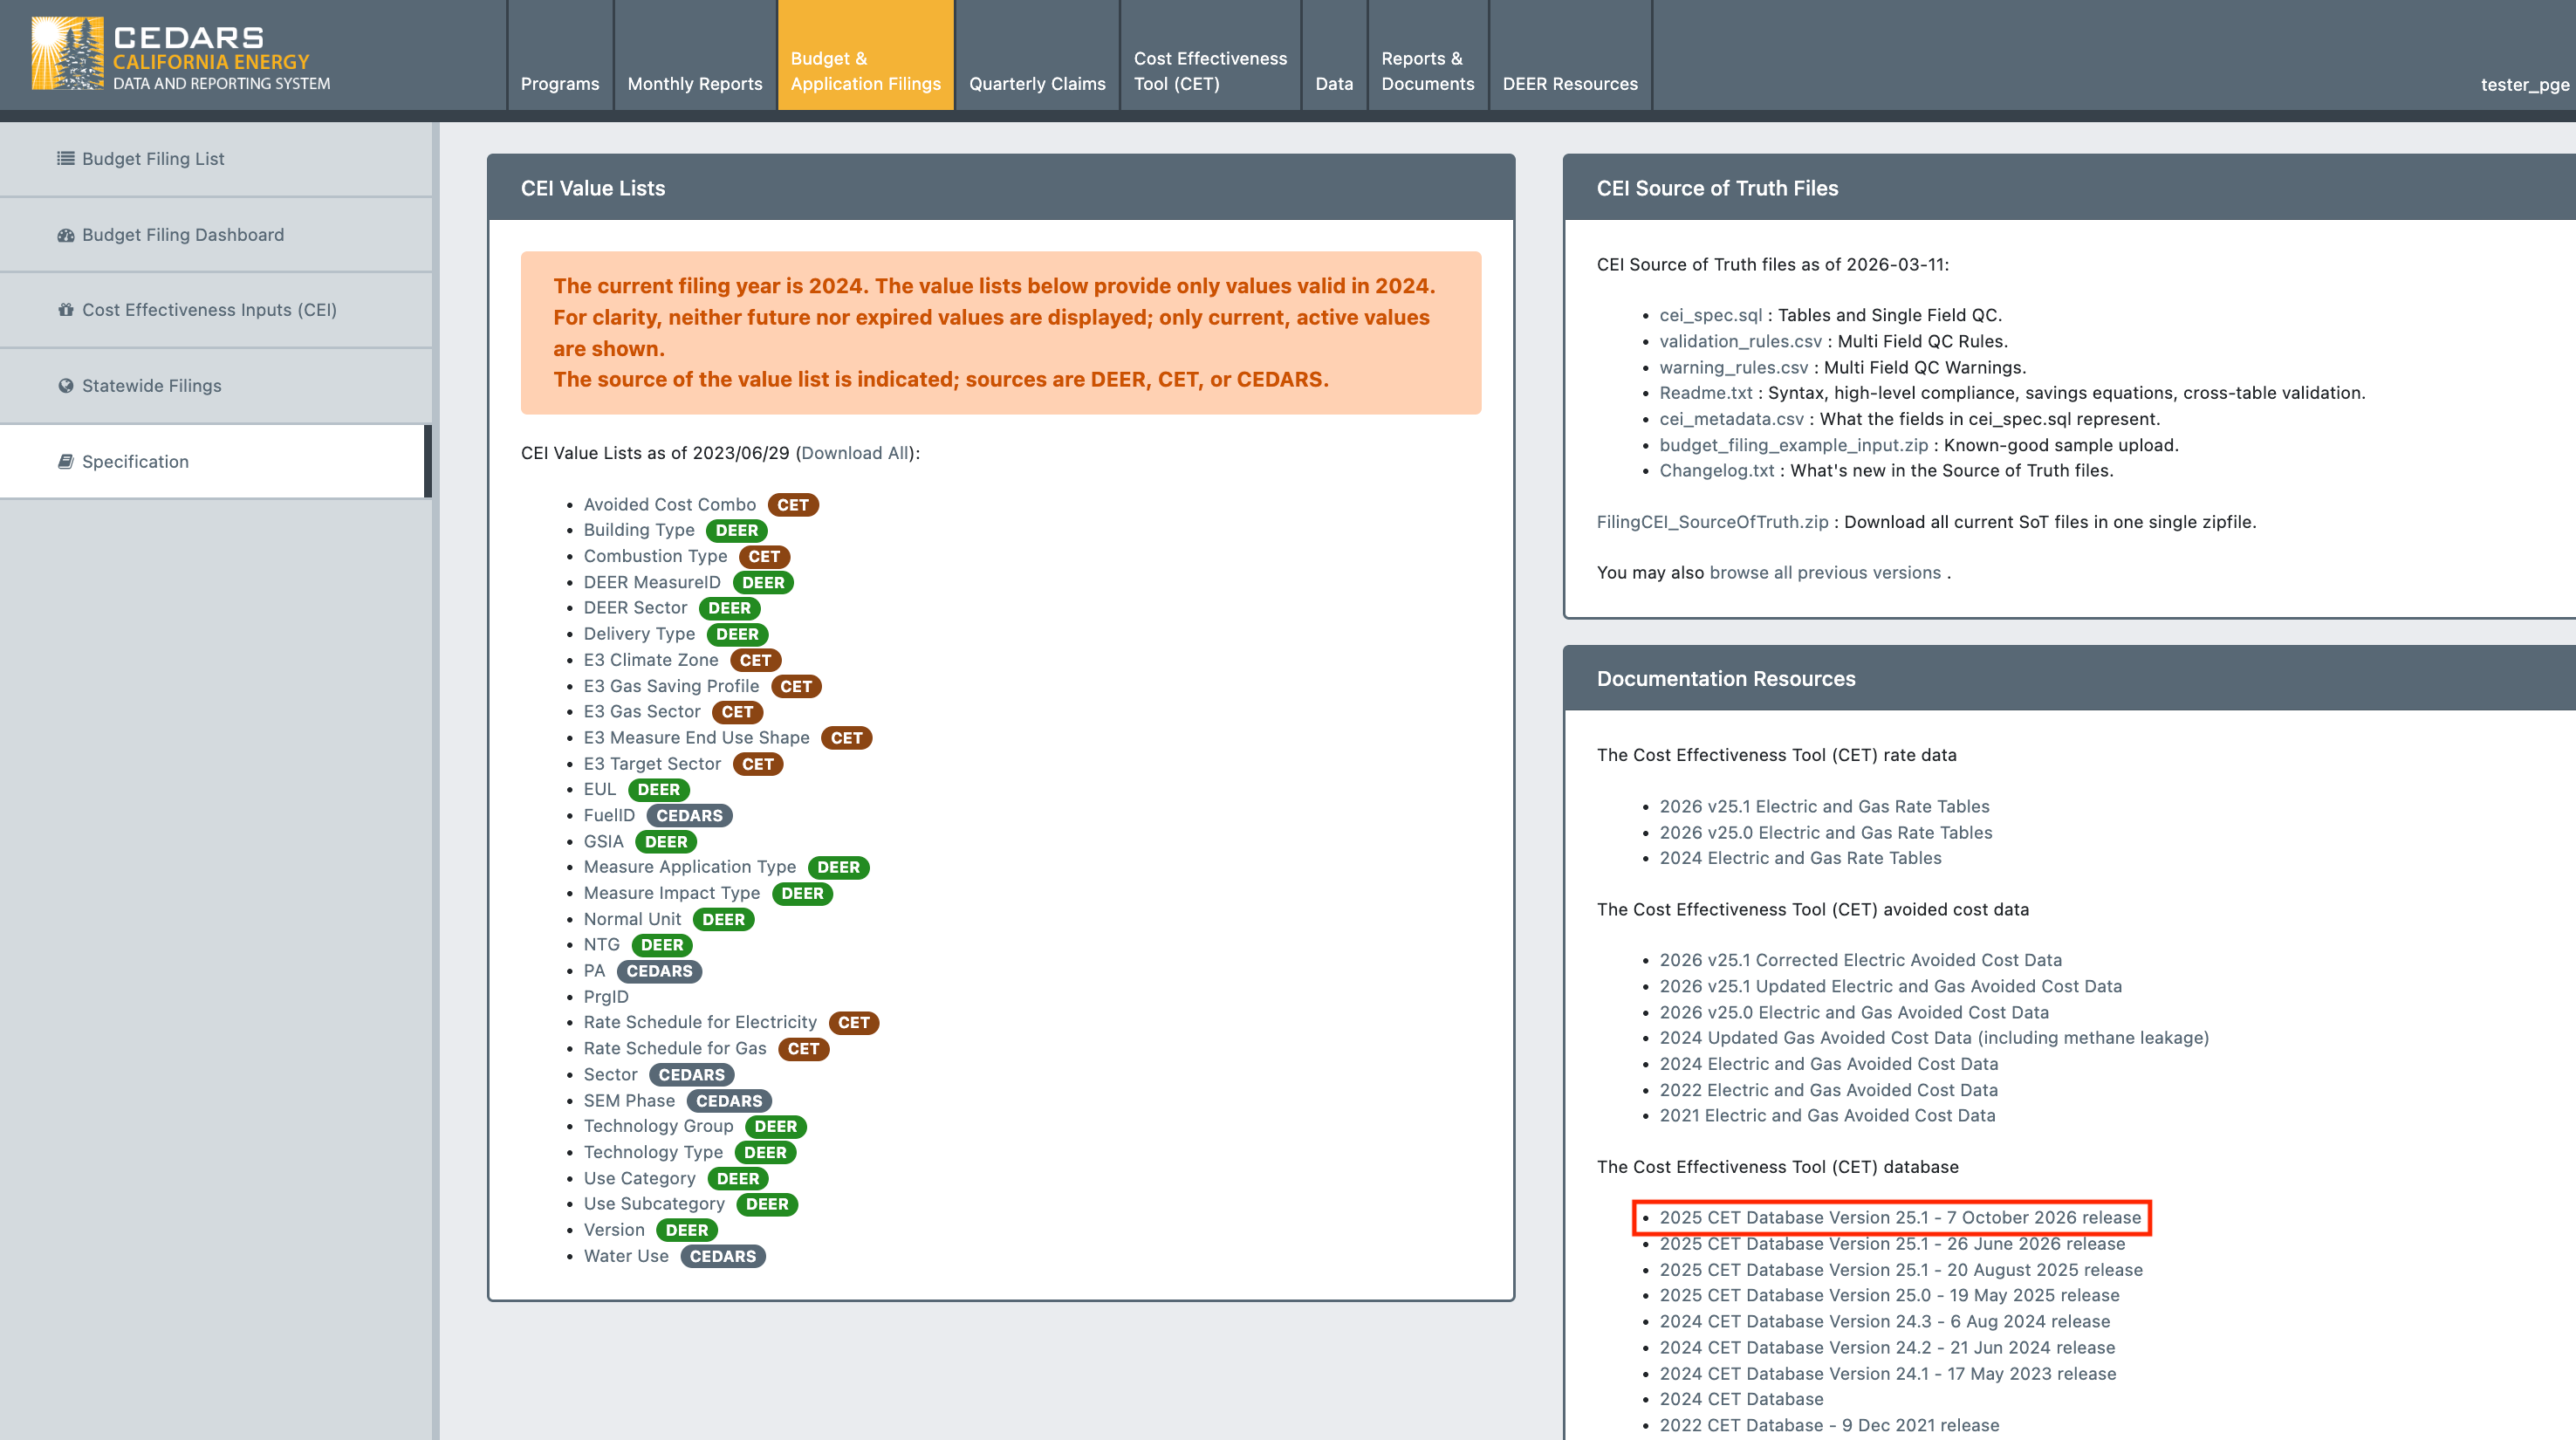
On June 26, 2026, a corrected 2026 version of the electric Avoided Cost table used for the 2026 and 2027 program years was added to the CET. The new data table resolves a day-shifting code error that affected the 2026 version electric avoided costs, and correspondingly the calculated cost effectiveness outputs using those costs, since the 2026 version was released in August 2025. The issue caused electric avoided costs to be misaligned with the hourly impact profile day of the week when calculating the quarterly avoided cost data used in the CET to calculate cost effectiveness metrics.

The correction affects the following electric cost effectiveness outputs:

  • Total System Benefit (TSB)

  • Total Resource Cost (TRC)

  • Program Administrator Cost (PAC)

  • Ratepayer Impact Measure (RIM)

  • Societal Cost Test (SCT)

The following outputs were not affected:

  • Energy savings (kW, kWh, Therms)

  • GHG outputs

  • All Gas cost effectiveness calculations

Action Required

Users who generated CET results using the previous avoided cost data should review their analyses and, as needed, rerun cost effectiveness calculations using the corrected version, available as Avoided Costs 2026 in the CET run parameters.

June 15th, 2026

Improved

Fixed

Load Shapes

Load shape uploads containing building location values prefixed with "CZ" will now process without error.

Improved Load Shape Upload Handling

What changed

  • Expanded Building Location Input Validation: Users can now upload building location values in both integer and "CZ"-prefixed formats (e.g., "1" or "CZ01") without encountering server errors. The underlying lookup logic has been updated to handle these expanded formats, increasing overall flexibility and reducing potential upload issues.

Why

  • Resolved an issue where validation passed but a server error occurred post-processing due to non integer inputs.

How to utilize

  • Ensure that your load shape files include valid building location formats. Both integer-based entries and "CZ"-prefixed formats are accepted.

June 10th, 2026

New

CET

Impact Profiles

CEDARS now supports creating Impact Profiles derived from uploaded deemed load shapes.

This release introduces the first MVP version of the Load Shapes Tool, focused on supporting draft measure package development and Impact Profile generation for cost effectiveness analysis. Future enhancements will continue to improve performance, visibility, and usability.

The Load Shape Tool can be accessed via the Cost Effectives Tool (CET) module > Impact Profiles & Load Shapes.

What's New

For Program Administrator Users

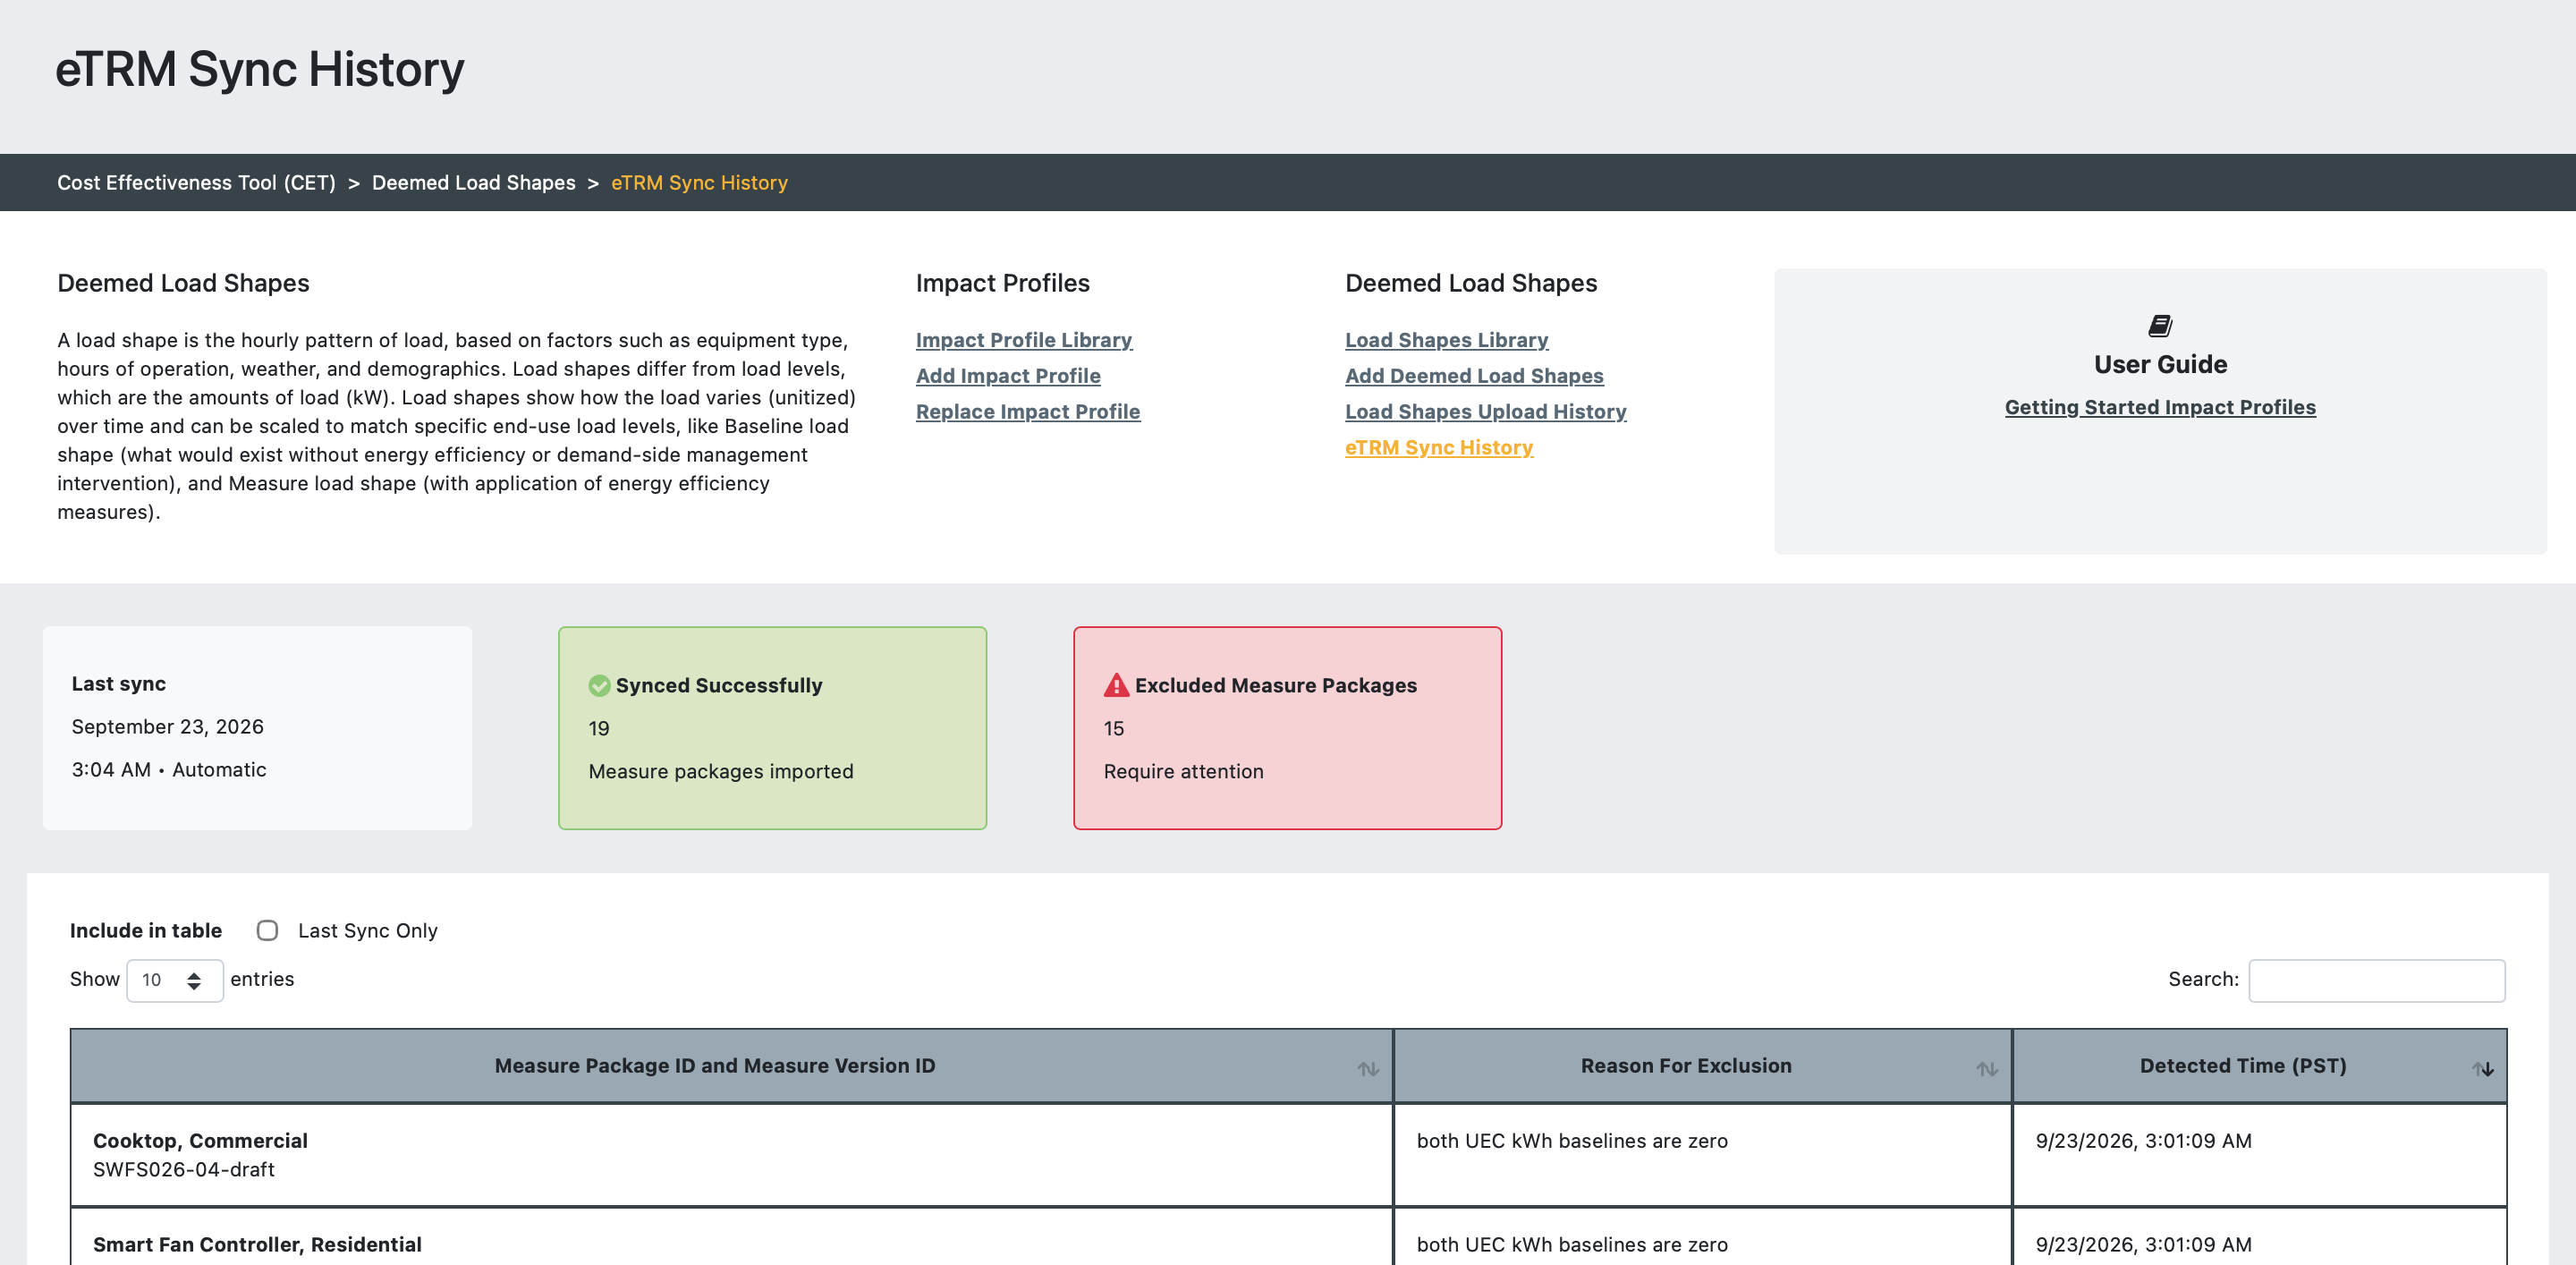
  • Select draft measure packages synchronized from eTRM.

  • Upload 8760 deemed load shape data.

  • Validate load shape files against measure package metadata and permutations from the eTRM.

  • View upload history and QC summary of uploads.

  • Add load shapes to the Load Shape Library.

  • Generate Impact Profiles from uploaded load shapes.

For All Authenticated Users

  • Browse the Load Shape Library.

  • View load shape derived Impact Profiles.

  • Use published Impact Profiles derived from load shapes in CET runs.

How It Works

  1. Draft measure packages are synchronized from eTRM to CEDARS each evening.

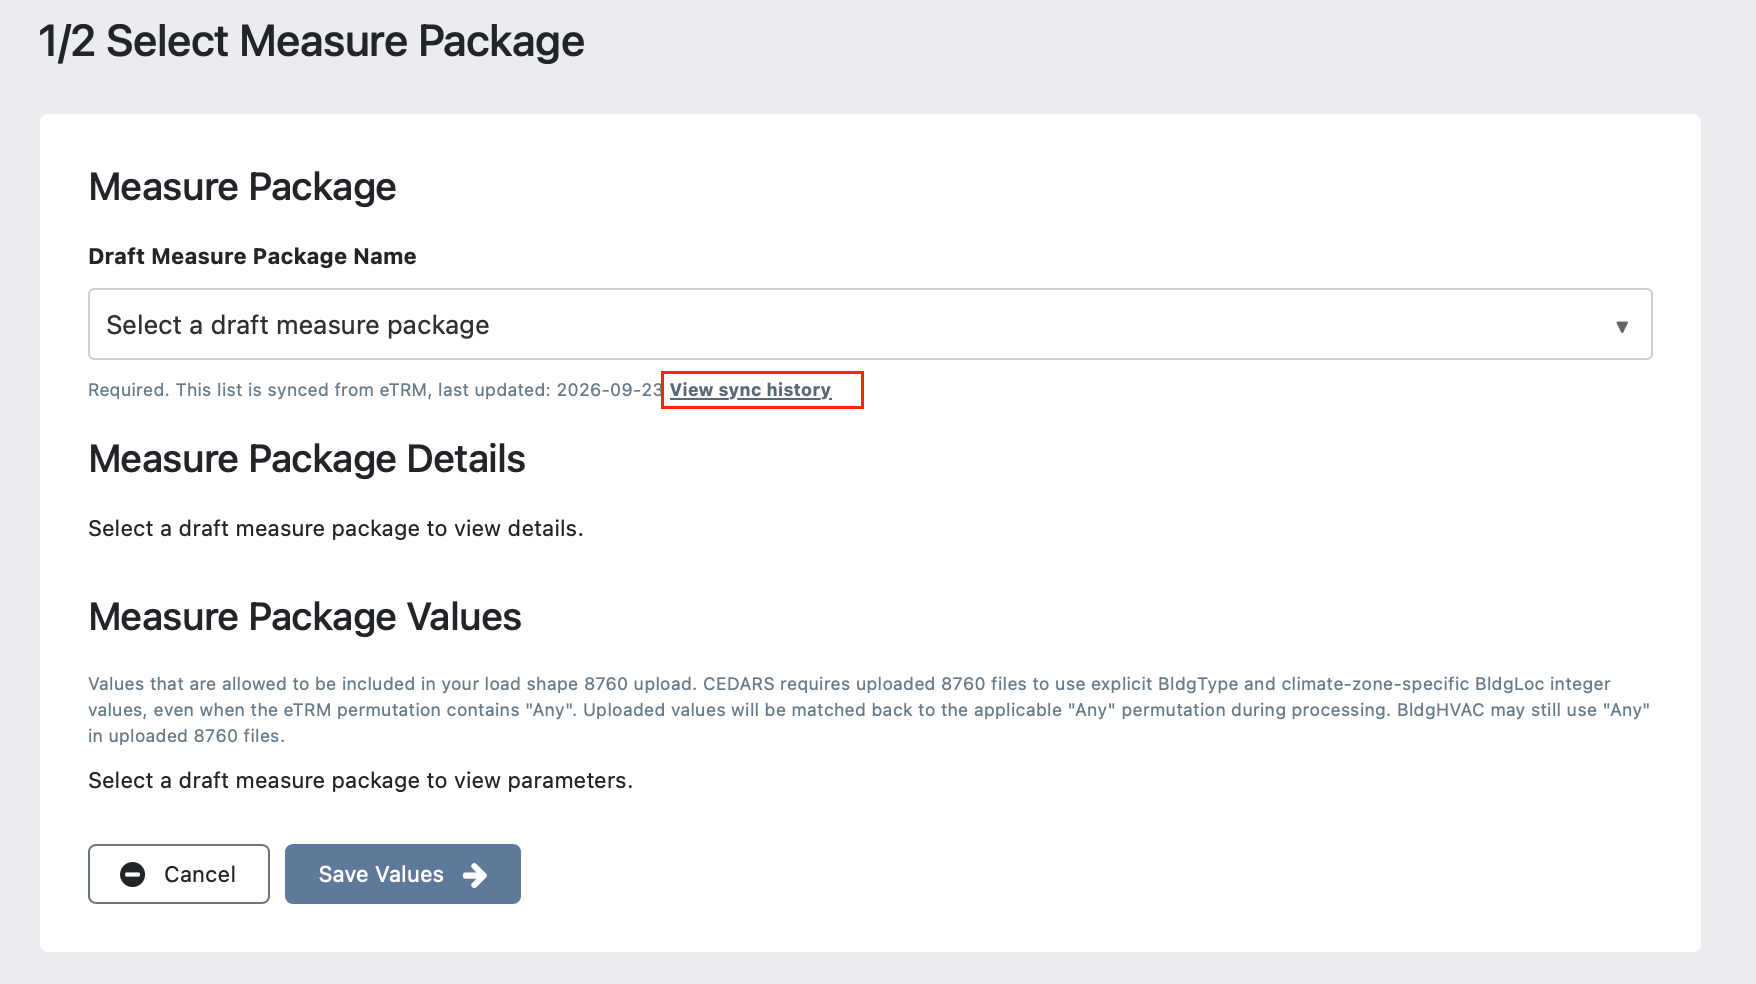
  2. Users select a draft measure package and review the permitted permutation values.

  3. Users upload associated 8760 load shape files.

  4. CEDARS validates the uploaded data against the measure package configuration.

  5. Successful uploads are added to the Load Shape Library.

  6. Users generate Impact Profiles from successful load shape uploads.

  7. CEDARS automatically calculates avoided costs.

  8. Published Impact Profiles become available for use in CET the following day.

Select measure package and view allowed values for the 8760 upload.
Upload Load Shapes 8760 data

8760 Load Shape Files

Load shapes files will be generated by EnergyPlus building simulation models in the correct format to be uploaded to CEDARS. A load shape provides normalized unit energy consumption for every hour of one year for a total of 8760 records per load shape.

New load shapes submit to CEDARS are identified by the fields:

  • BldgType

  • BldgVint

  • BldgHVAC

  • TechID

The buildings and technologies in the load shape file must match the draft measure data for the measure package selected for the upload. PAs may upload load shapes for subsets of the technologies in a measure package, or for all technologies.

CEDARS requires 8760 files to use explicit BldgType and climate-zone-specific BldgLoc integer values, even when the eTRM permutation contains "Any". Uploaded values will be matched back to the applicable "Any" permutation during processing. BldgHVAC may still use "Any" in uploaded 8760 files. View Example File

Users can generate impact profiles from uploads that pass all validation checks
Load Shapes are automatically added to the library, where you can view the daily consumption profiles.
Generated Impact Profiles are added to the library, to view you can filter by Load Shapes

Benefits

This feature streamlines the process of developing and testing draft measures by providing a direct workflow from eTRM measure package development through to Impact Profile generation and CET evaluation within CEDARS.

Documentation

User guides and supporting documentation for Load Shapes, including upload requirements, validation rules, and processing logic, are currently being finalized and will be published in CEDARS shortly.

ℹ️ Future enhancement: A dedicated Measure Developer user type is currently under development. This role will provide access to the Load Shapes workflow without requiring broader Program Administrator permissions.

April 22nd, 2026

Improved

Budget Filing

Ability to edit Advice Letter, Application Number, and URL fields after filing submission

  • The “Change Application Number & Advice Letter” form is now available even after a filing is submitted for PA users.

  • This allows changes to Application Number, Advice Letter, and/or the URL fields to be made both up to and after the filing submission.

Inclusion of Application Number and URL fields in Budget Filing Receipt pdf

  • The completeness of the Budget Filing Receipt has been enhanced by adding the Application Number field and URL fields.

  • The “Advice Letter Number” field has been renamed to “Advice Letter” in the Budget Filing Receipt, to maintain consistency with the field name used across the Budget Filing Dashboard.

  • Past receipts will not be changed, but new receipts will contain these fields when generated.

March 12th, 2026

Fixed

Specification

CET

The example CET upload file has been updated to align with the current CET specification.

What changed

  • The field previously labeled PA in the example CET measure.csv has been renamed to IOU_AC_Territory.

Where

Why

  • This field name had already been updated in the CET and metadata files, but it was missed in the example upload file.

  • The example file now matches the current specification to avoid confusion when preparing CET and Filing uploads.

Files affected

  • cet_example_input.zip (measure CSV inside the example upload)

March 11th, 2026

Improved

The CEDARS team support email that is offered to users has been updated in several locations across the CEDARS site from "cedars-help@sound-data.com" to the current "cedars-team@sharperinfo.com".

January 8th, 2026

New

CET

Users now have the ability to cancel CET runs. This resolves previous concerns about accidentally selecting incorrect files or handling files stuck in pending statuses.

✨ New features

  • Added a Cancel Run action to CET Upload History table for runs that are actively processing.

  • Introduced a confirmation screen when canceling a run, including the JobID so users can verify they’re canceling the correct job.

  • Selecting Keep Running CET returns users to Upload History with the job continuing as normal.

  • Selecting Yes, Cancel Run updates the run status to Canceled in CET Output.

  • Canceled runs persist after refresh and retain their JobID for traceability.

December 8th, 2025

New

Data & Reports

Navigation Updates

We've made updates to the CEDARS navigation to enhance your experience and simplify access to key dashboards. Here's what you need to know:

What's Changed?

  1. “Data” Tab - Relocation and Renaming of Pages:

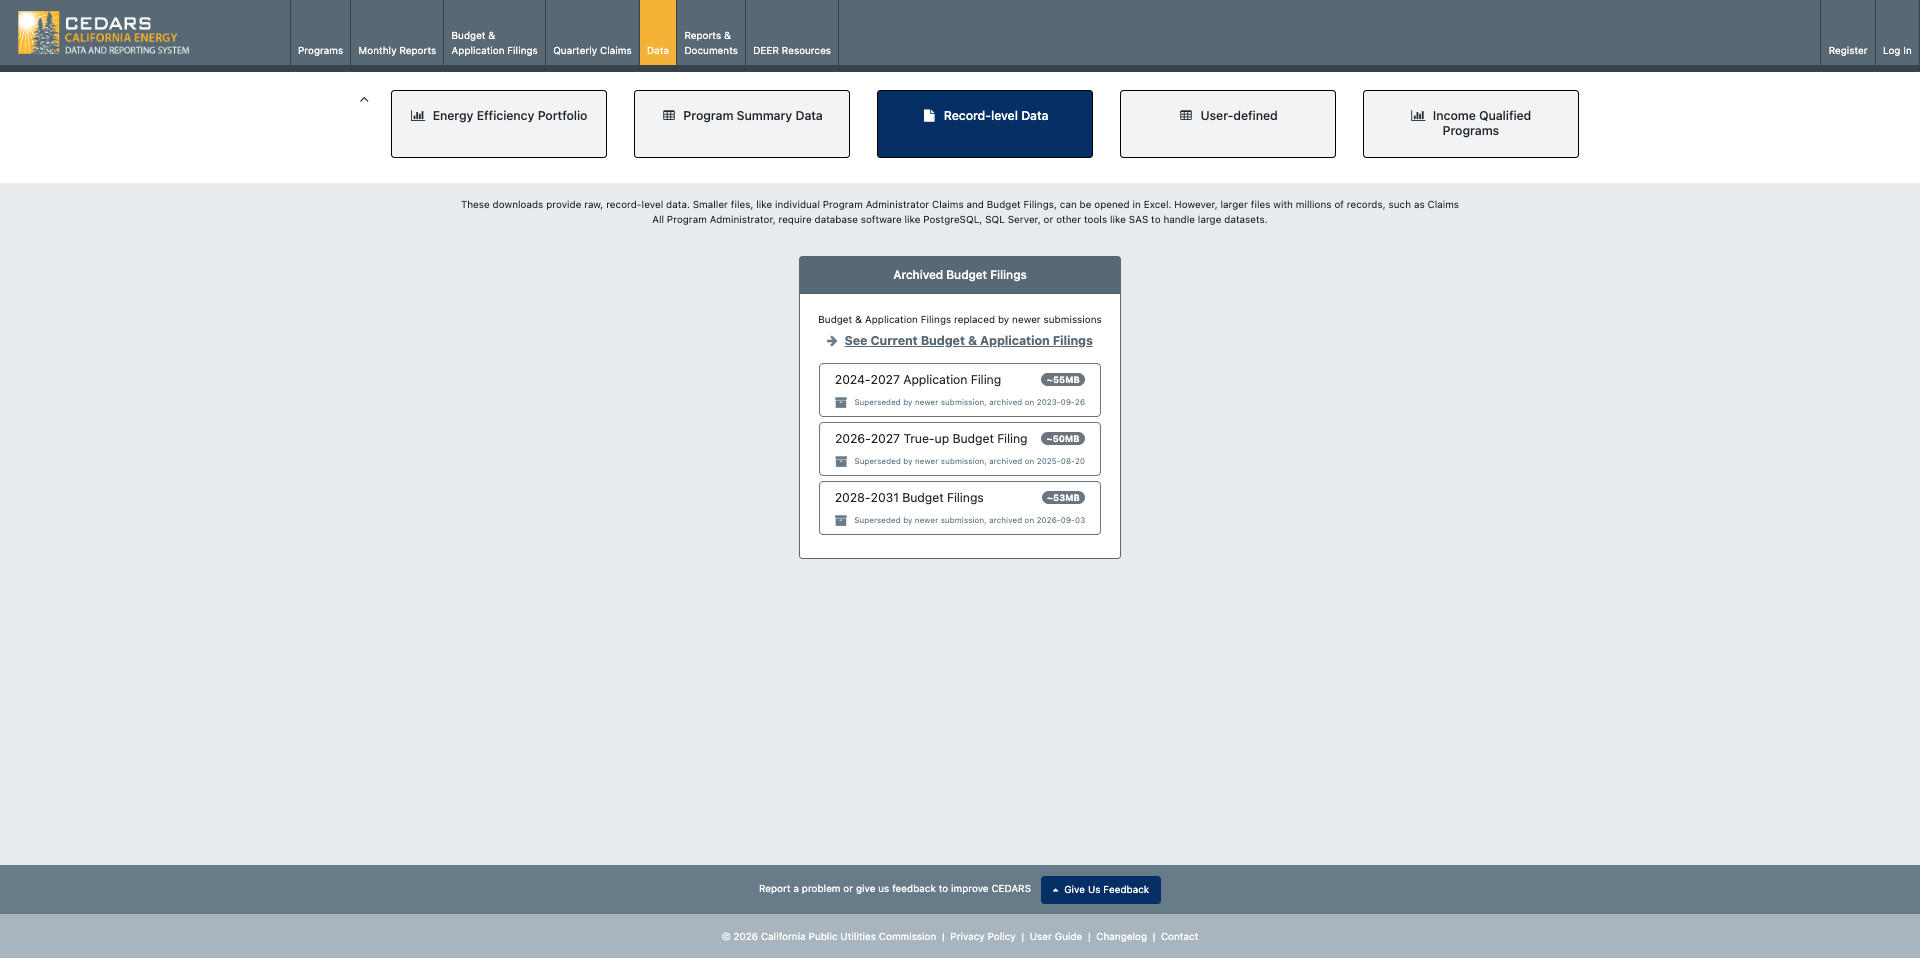
    • The "Data" tab on the top navigation bar provides a comprehensive view of California’s energy efficiency portfolio through multiple dashboards and data tools.

    • The "Income Qualified Program Data" tab has been relocated to a page in the "Data" tab as "Income Qualified Programs".

    • The “Summary” page has been renamed to “Program Summary Data”.

    • The "Record-level Downloads" page has been renamed to “Record-level Data”.

  2. The “Documents” tab has been renamed to “Reports & Documents”.

  3. We have added new “Energy Efficiency Portfolio” page.

Why Are We Making These Changes?

We aim to enhance usability by consolidating related features into one accessible location. This update will streamline navigation, making it easier for you to find tools and information more efficiently.


New “Energy Efficiency Portfolio” Dashboard

https://app.powerbi.com/view?r=eyJrIjoiNmJhYTY2OTktZTRmYS00MDU2LTgzMWEtMzc4MDlhYTQ2MzA0IiwidCI6IjI4YmViZTNmLTFjNTUtNDI1NS05OGZhLTBkNmMwNWM0ZjlmNSIsImMiOjZ9&pageName=bde3a9db9a25101b2081

Annual Claims

As part of Phase 1, this dashboard includes 2024 data only.

The dashboard provides a detailed and interactive analysis of statewide and local program performance, focusing on six key areas:

  • Goal Achievement

  • Forecast vs. Claimed

  • Cost Effectiveness

  • Budget and Expenditures

  • Energy Savings

  • Environmental Impact

The dashboard provides straightforward insights to help users gauge program efficiency, environmental results, and financial management.

Goal Achievement

Goal Achievement offers a clear view of each Investor-Owned Utility’s (IOU) progress toward its targets. The dashboard highlights goal attainment (Claimed vs. Goal) and the percentage achieved across key metrics: Total System Benefit, Electric Savings, Gas Savings, and Total Expenditures. It enables quick comparison of actual results against targets and helps track overall performance.

Forecast vs. Claimed

The Forecast vs. Claimed view compares what was projected in each PA’s budget application with what was actually delivered. Users can quickly see variances across Total System Benefit, Electric Savings (MWh), Electric Savings (MW), Gas Savings (MMTherms), and Total Expenditures. This view highlights where programs are outperforming, meeting, or falling short of forecasts

Cost Effectiveness

The Cost Effectiveness view provides key indicators such as the Total TRC Ratio, Total PAC Ratio, and Total RIM Ratio, enabling users to assess the overall efficiency and impact of programs. By analyzing these ratios, stakeholders can identify opportunities to optimize resource allocation and maximize program benefits.

Budget and Expenditures

The Budget and Expenditures view provides key indicators such as Filed Budget and Total Expenditures Claimed. In addition to high-level metrics, users can view a breakdown of Total Expenditures including Direct Implementation Costs, Rebates and Incentives, Admin Costs, Marketing Outreach, EMV, and Costs Recovered from Other Sources across different Implementer Types.

Energy Savings

The Energy Savings view tracks critical data points, including kWh Savings, Therm Savings, and kW Savings. These metrics provide a comprehensive view of energy conservation trends, helping to pinpoint areas where initiatives have successfully reduced consumption and identifying where additional efforts may be needed.

Environmental Impact

In the area of Environmental Impact, the dashboard provides insights into pollutants such as CO2, PM10, and NOx. This data helps measure the environmental benefits of programs, offering a quantitative basis for evaluating their contribution to cleaner air and a healthier ecosystem.


By combining these robust data points, the dashboard provides an intuitive yet comprehensive tool for stakeholders to evaluate and enhance program performance across multiple dimensions, driving sustainable and impactful outcomes.

Forecast

As part of Phase 2, this dashboard includes 2024-2027 data only.

Introduces multi-year visibility into program planning by incorporating 2024–2027 forecasted annual targets. The dashboard provides a comprehensive view of projected performance across six key areas:

  • Program Cycle Summary

  • Annual Targets

  • Budget & Cost Effectiveness

  • Budget Detail

  • Energy Savings

  • Environmental Impact

These visualizations allow users to understand expected outcomes over the full program cycle, evaluate planned budgets and cost effectiveness, and track anticipated savings and environmental benefits.

Program Cycle Summary

The Program Cycle Summary provides a high-level view of projected performance over the full 2024–2027 cycle. It includes Program Cycle TSB Goals, TSB Forecasts, and Budget Forecasts, along with Program Cycle IOU Territory TSB Forecasts by PA. This view helps users assess whether long-term forecasts align with statewide goals and planned budgets.

Annual Targets

The Annual Targets view compares each year’s TSB Target against the TSB Forecast, highlighting gaps or over-performance at a glance. It also includes IOU Territory TSB Forecasts by PA, offering a clearer picture of how annual expectations vary across service territories.

Budget & Cost Effectiveness

Budget & Cost Effectiveness presents Annual TSB Forecasts alongside Budget Forecasts to show how projected benefits relate to planned spending. It also includes Annual Cost Effectiveness Forecasts and program-level CE data, enabling users to evaluate expected value and efficiency across portfolios.

Budget Detail

The Budget Detail view breaks down Total Budget by category and shows Budget allocation by portfolio segment as a percentage of the total. This helps users understand how funding is distributed and where major cost drivers sit within the forecast period.

Energy Savings

The Energy Savings view provides forecasts for Electric Savings (kWh), Gas Savings (Therms), and Demand Savings (kW). These indicators allow users to track expected conservation outcomes and compare projected savings across technologies and portfolios.

Environmental Impact

The Environmental Impact view includes forecasted CO₂, PM10, and NOx reductions, expressed in metric tons. Program-level environmental impact forecasts are also included, giving users a clear understanding of anticipated air quality benefits associated with planned program activities.


November 14th, 2025

Improved

Budget Filing

Data & Reports

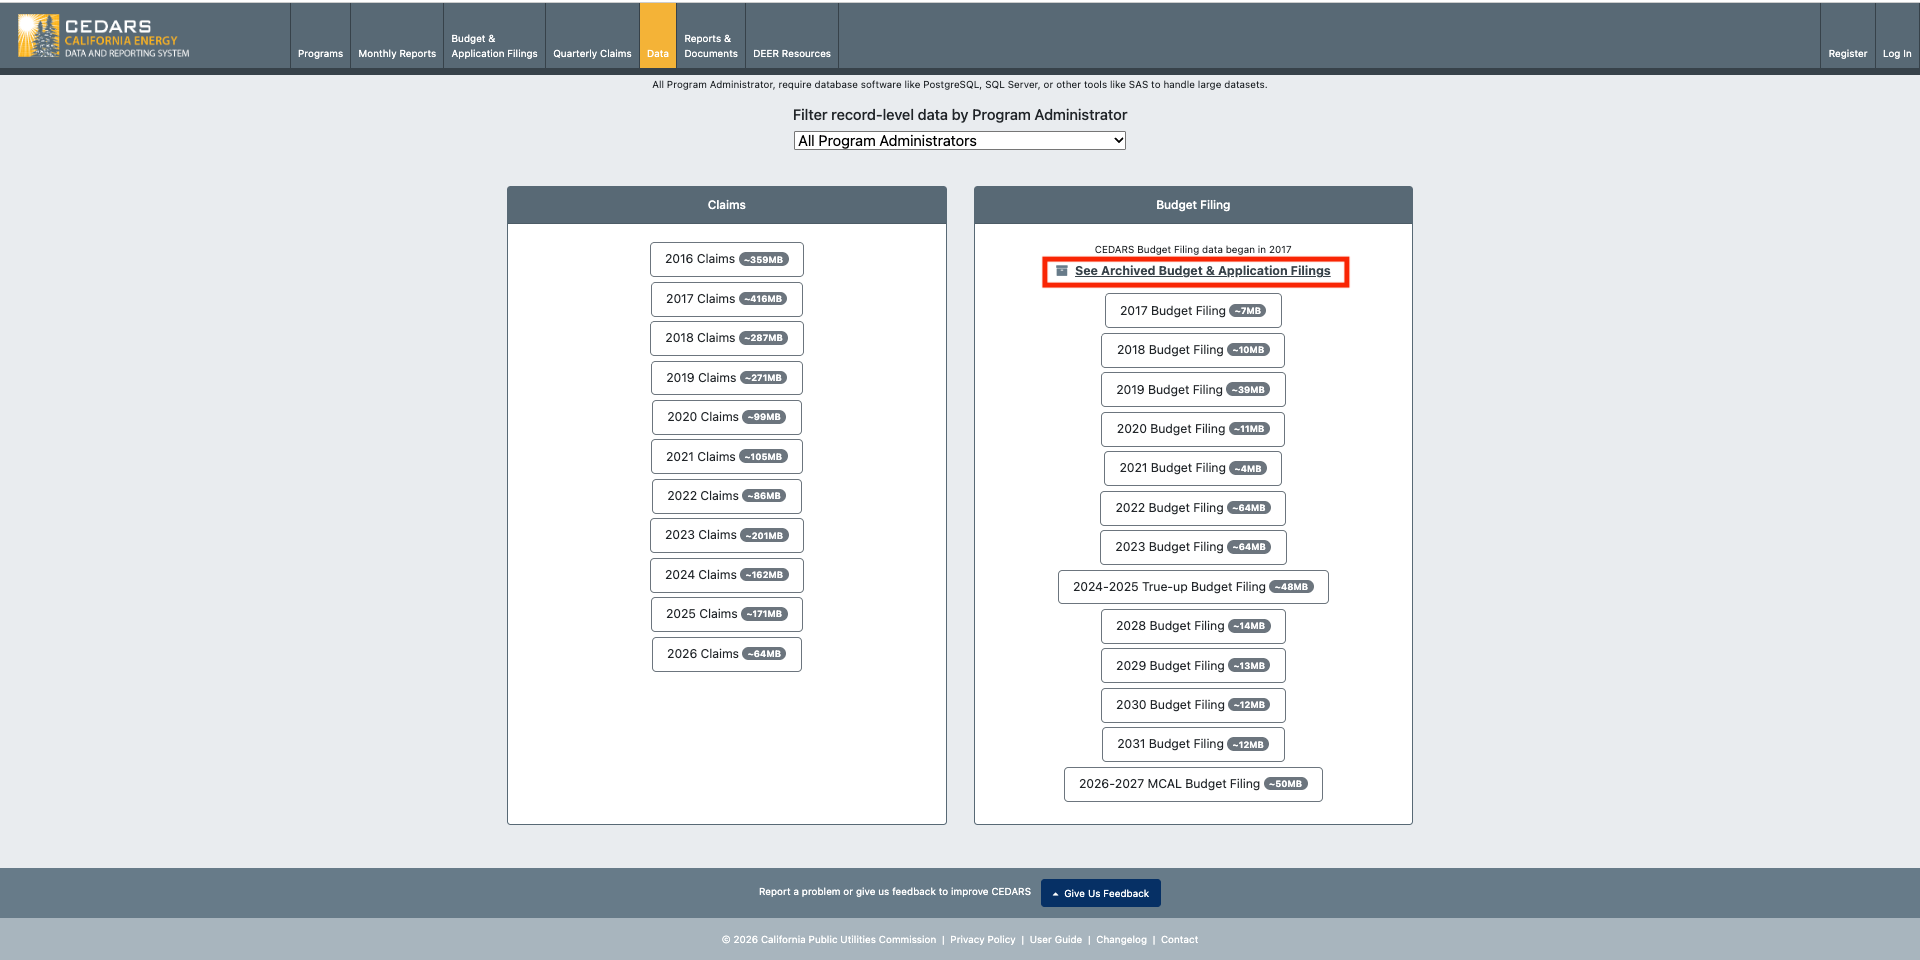
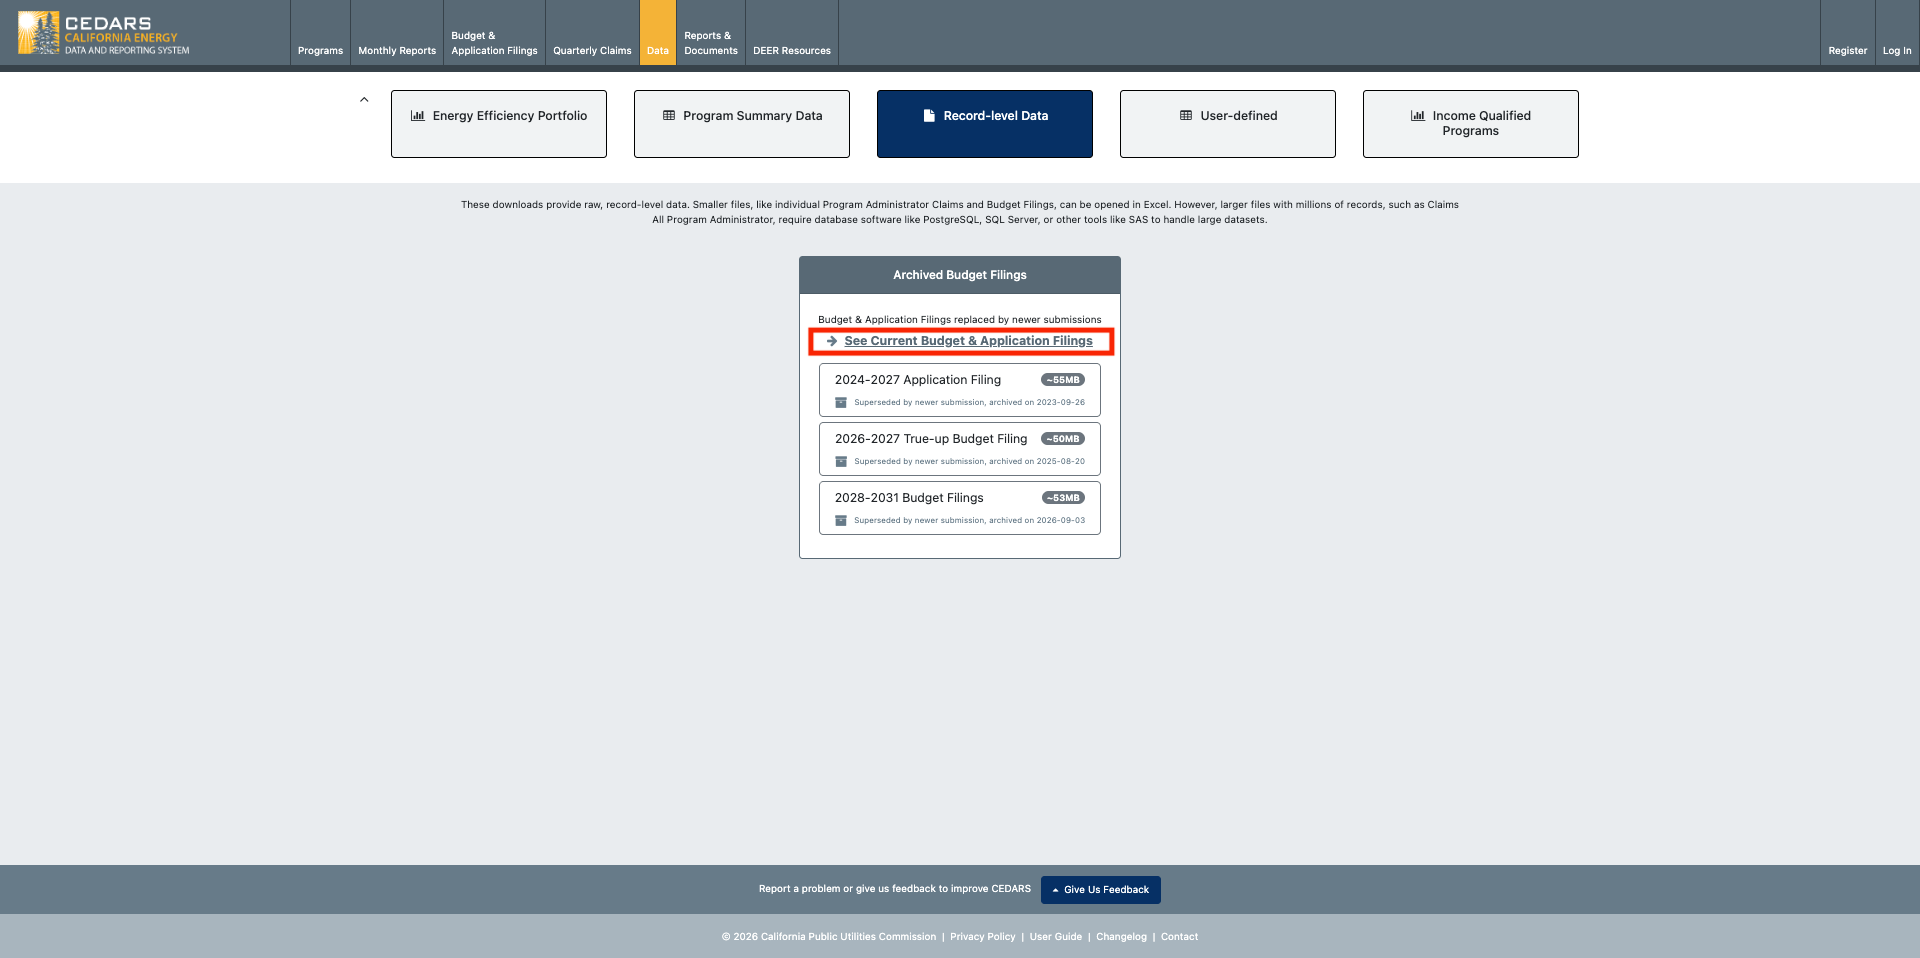
We’ve expanded the 2026–2027 MCAL Budget Filing download on the Record-level Data page in CEDARS.

What’s new

  • The full set of CET cost-effectiveness fields has been added to the Record-level Data download.

  • The data source for this download has now been aligned with the Budget Filing Cost Effectiveness Data download on the PA Filing Dashboards.

  • Both downloads now use one consolidated dataset, including all program-level details

Fields added:

Fuel ID

Unit Tax Credits

Water Energy Benefits

Water Energy Benefits Gross

Water Energy Cost

Water Energy Cost Gross

Electric Bill Reduction

Electric Bill Increase

Gas Bill Reduction

Gas Bill Increase

Electric Benefits Gross SCB

Electric Benefits Gross SCH

Electric Benefits SCB

Electric Benefits SCH

Electric Supply Cost Gross SCB

Electric Supply Cost Gross SCH

Electric Supply Cost SCB

Electric Supply Cost SCH

Gas Benefits Gross SCB

Gas Benefits Gross SCH

Gas Benefits SCB

Gas Benefits SCH

Gas Supply Cost Gross SCB

Gas Supply Cost Gross SCH

Gas Supply Cost SCB

Gas Supply Cost SCH

RIM Cost No Admin

SCB Cost

SCB Cost Gross

SCB Ratio No Admin

SCH Cost

SCH Cost Gross

SCH Cost No Admin

SCH Ratio No Admin

Tax Credits

Tax Credits Gross

Water Energy Benefits Gross SCB

Water Energy Benefits Gross SCH

Water Energy Benefits SCB

Water Energy Benefits SCH

Water Energy Cost Gross SCB

Water Energy Cost Gross SCH

Water Energy Cost SCB

Water Energy Cost SCH