Impact profiles and DST
Good afternoon!
My understanding is that both impact profiles and avoided costs follow the “1-8760 hrs” format.
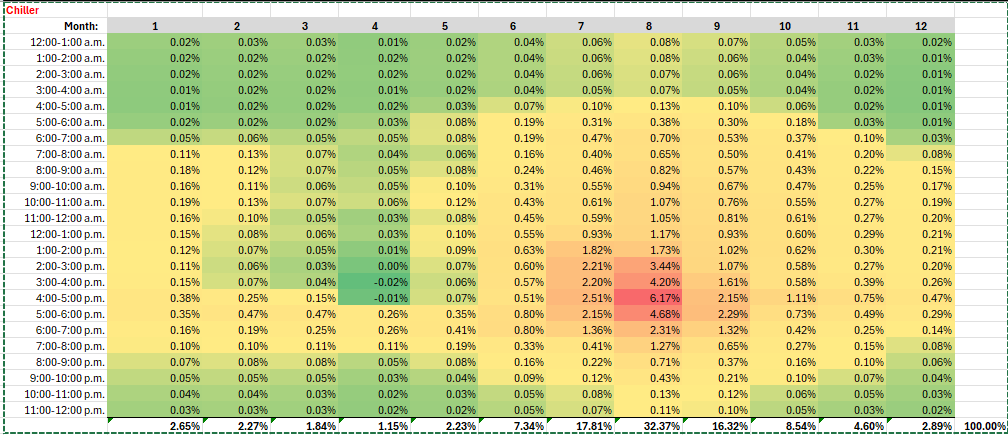
I would like to prepare a “heat diagram” to show where the highest value savings occur. I do this by multiplying hourly avoided cost x impact profile hourly factors.
In the Impact Profile FAQ it says that “…the need for special handling during DST is eliminated.”
It is not clear to me, if the resulting heat diagram, as summarized and shown below, is in Standard or Prevailing Time.
Thanks, Olaf Roepke
- Select the module in CEDARS
Log in to comment and vote
Comments1
cedars team
Mar 19
Hi @oroepke , Impact profiles and the data you are seeing is in standard time. I’m including some additional documentation for you, and we will look to add this to the impact profile user guide on CEDARS.
Please reach out if you have any other questions.
Custom Measure Load Shape Tools Documentation_Final.pdf
882.5 KB• Document