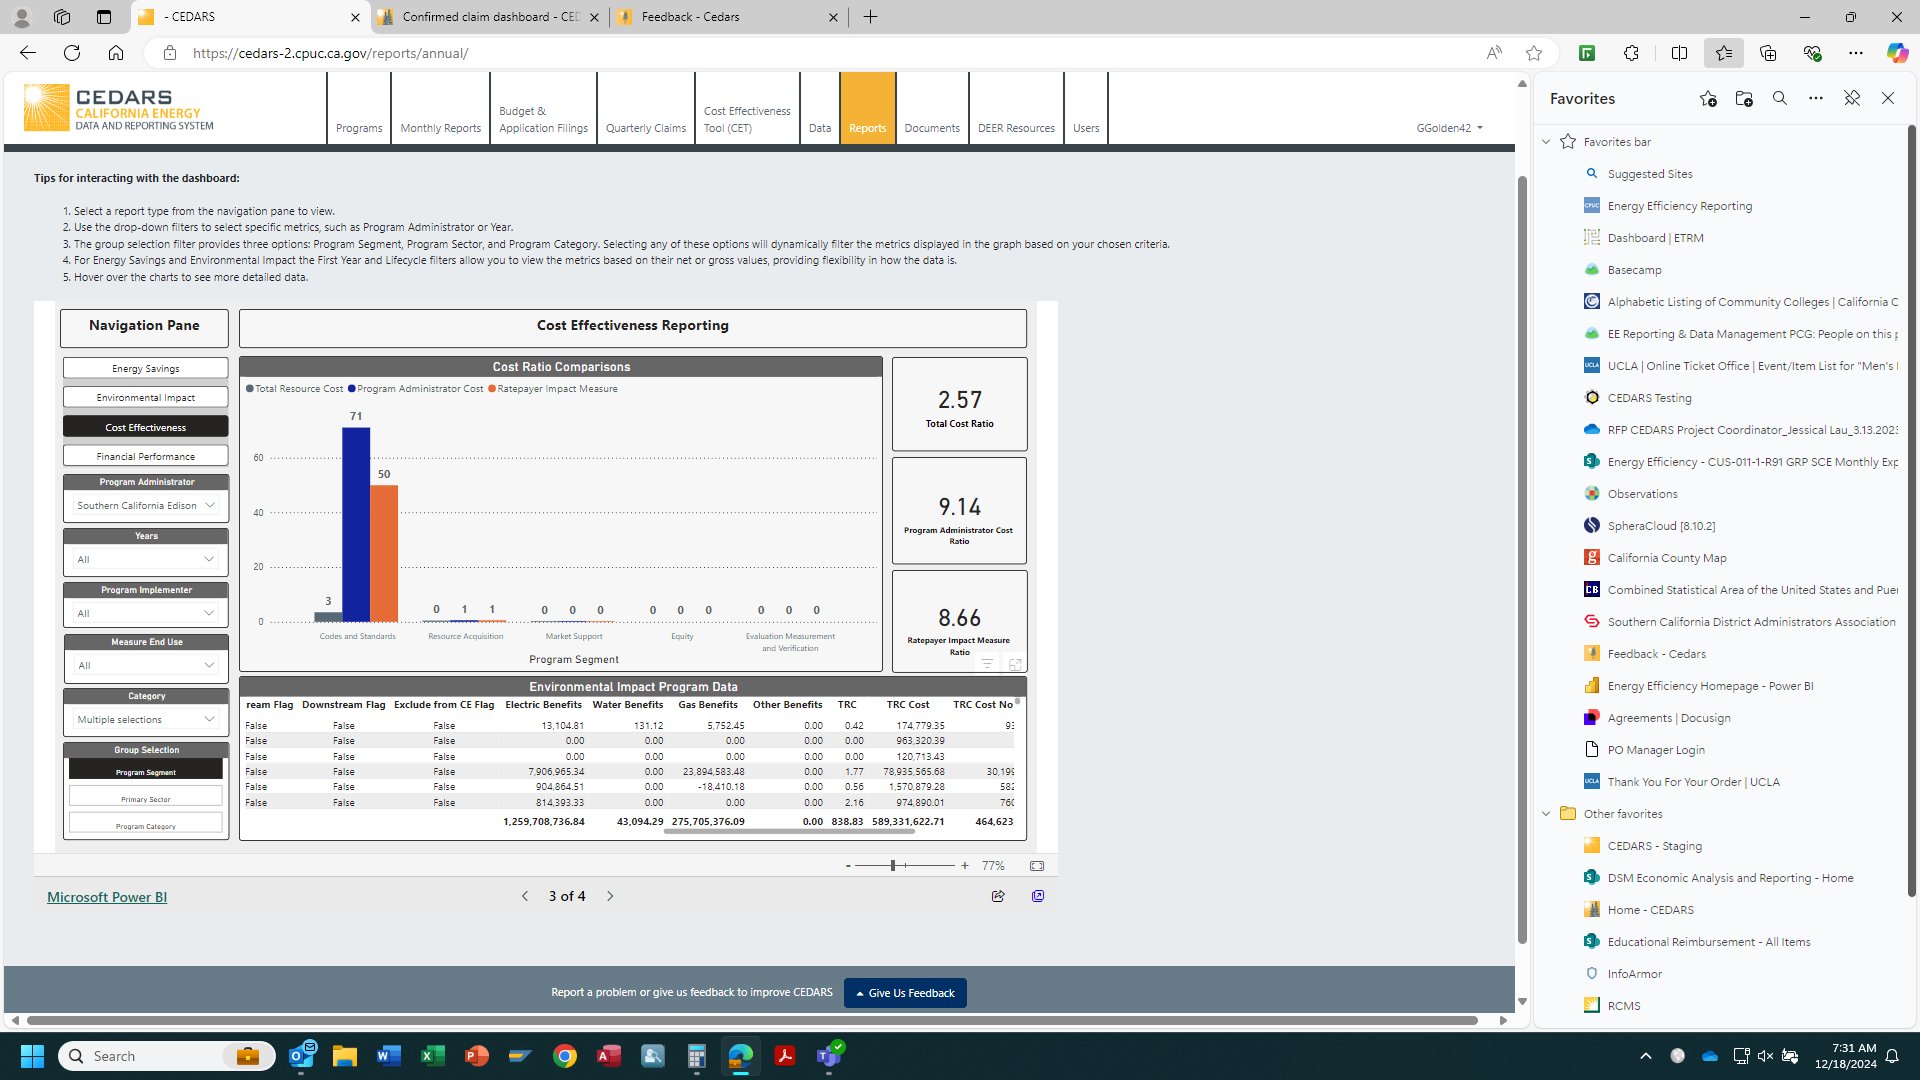
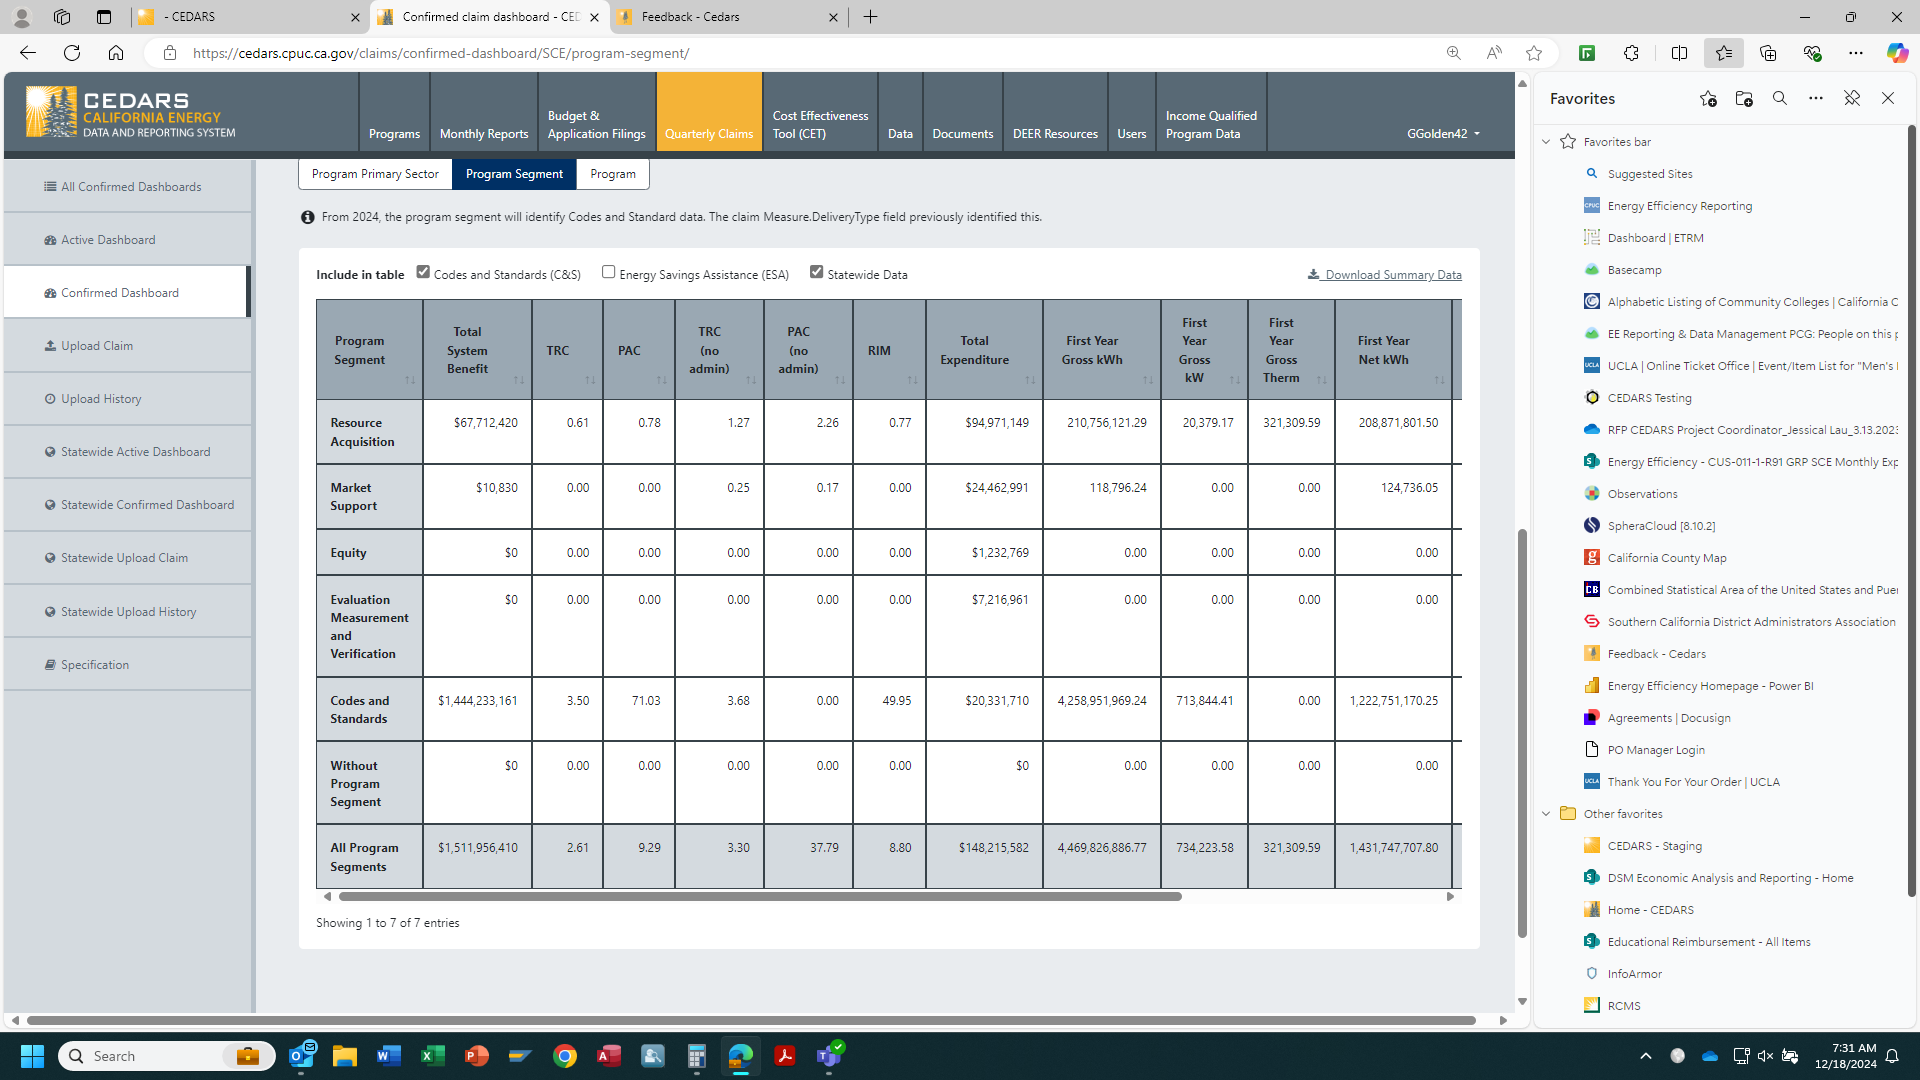
Cost Effectiveness Calculations for Dashboard
For SCE, the CE calcs are not matching the dashboards in the charts. The program level detail below the charts matches but not the graphs or the totals on the side. If you look at the first chart (both exclude Energy Savings Assistance) the TRC is 2.57 up top but if you add the total benefits and divide by TRC costs from the detail you get 2.61 which matches the total from the second chart which is the Production Dashboard from 2023.
Please authenticate to join the conversation.
Upvoters
Status
Completed
Board
🗒️
Testing Feedback
Date
Over 1 year ago
Author

GGolden42
Subscribe to post
Get notified by email when there are changes.
Upvoters
Status
Completed
Board
🗒️
Testing Feedback
Date
Over 1 year ago
Author
GGolden42
Subscribe to post
Get notified by email when there are changes.